Fuel Dashboard

WHAT IS IT?

The Fuel Dashboard provides transportation and logistics professionals with a centralized view of the energy markets that influence freight costs. Fuel is one of the most volatile cost drivers in transportation, and shifts in energy prices can quickly impact carrier margins, freight rates, and transportation budgets.

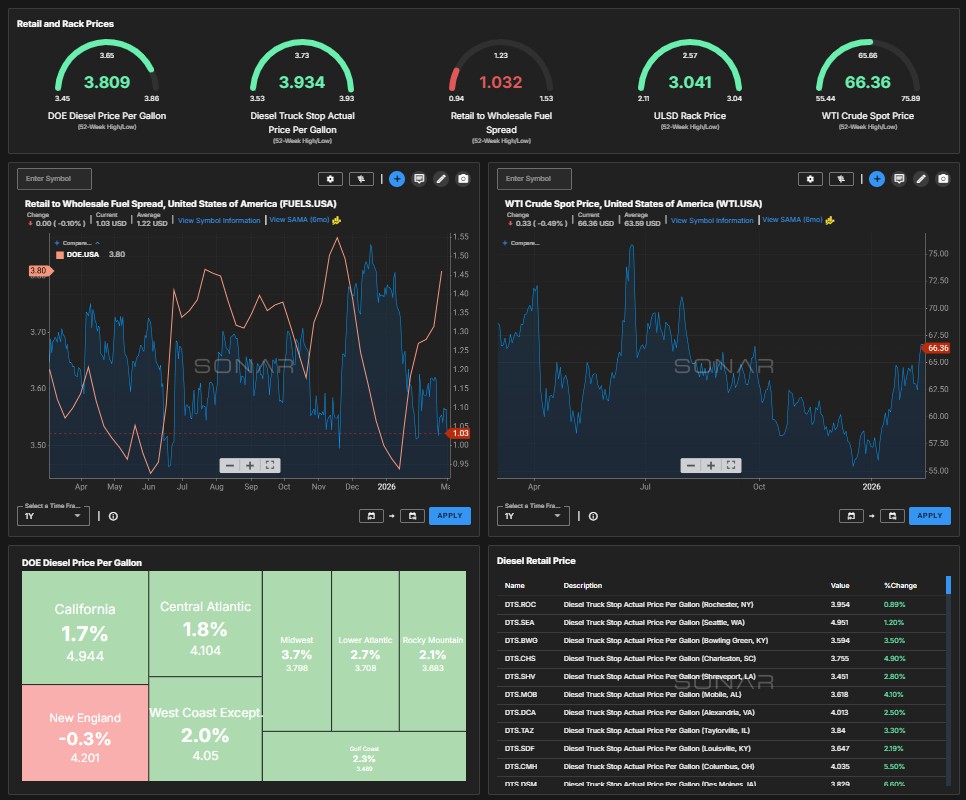
The Fuel Dashboard consolidates key fuel and energy indicators into one unified view, connecting upstream energy market signals with downstream diesel pricing and transportation fuel costs. By bringing these indicators together, the dashboard helps users understand how movements in crude oil, diesel, and related fuel markets translate into real-world impacts on freight markets.

With real-time visibility into fuel pricing trends and regional cost pressure, the Fuel Dashboard helps logistics teams anticipate cost changes, manage fuel exposure, and make more informed operational and pricing decisions.

WHAT DOES IT TELL ME?

The Fuel Dashboard provides visibility into energy market volatility and how it directly impacts transportation costs across freight markets.

Upstream Energy Market Signals

Fuel pricing in transportation ultimately originates from broader energy markets. The dashboard includes key upstream indicators that help identify early signals of fuel price movement.
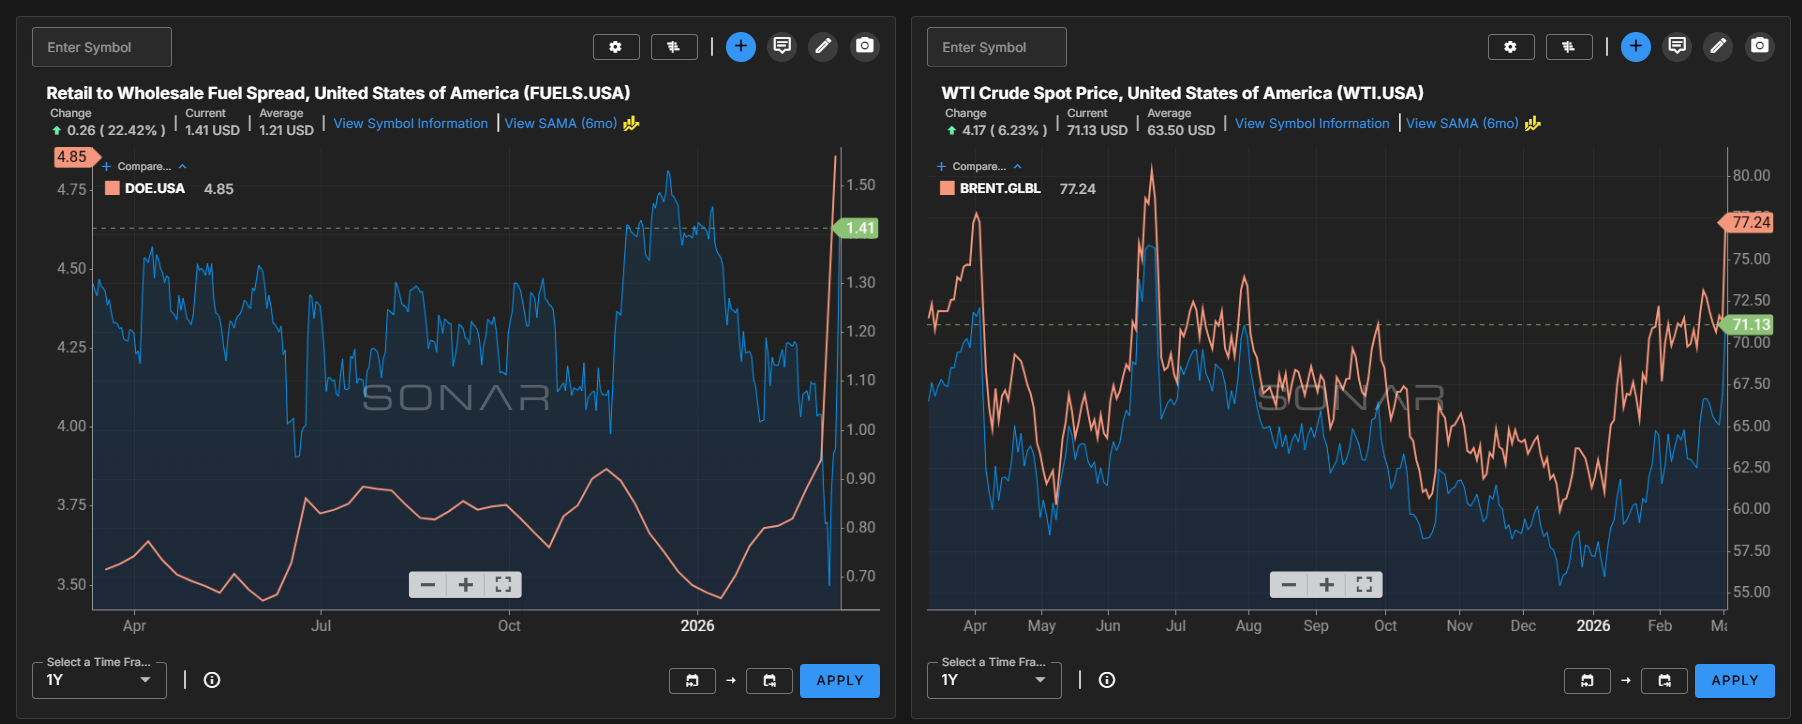
  • Crude Oil Spot Prices, the primary upstream driver of diesel fuel costs
  • Indicators that reveal early changes in energy supply and demand dynamics
  • Visibility into energy market movements before they fully impact diesel prices and freight costs

Fuel Dashboard

Monitoring these upstream signals helps users anticipate fuel-driven cost pressure earlier in the market cycle.

Diesel Pricing and Fuel Surcharge Indicators

The dashboard also tracks critical diesel pricing benchmarks widely used throughout the transportation industry.
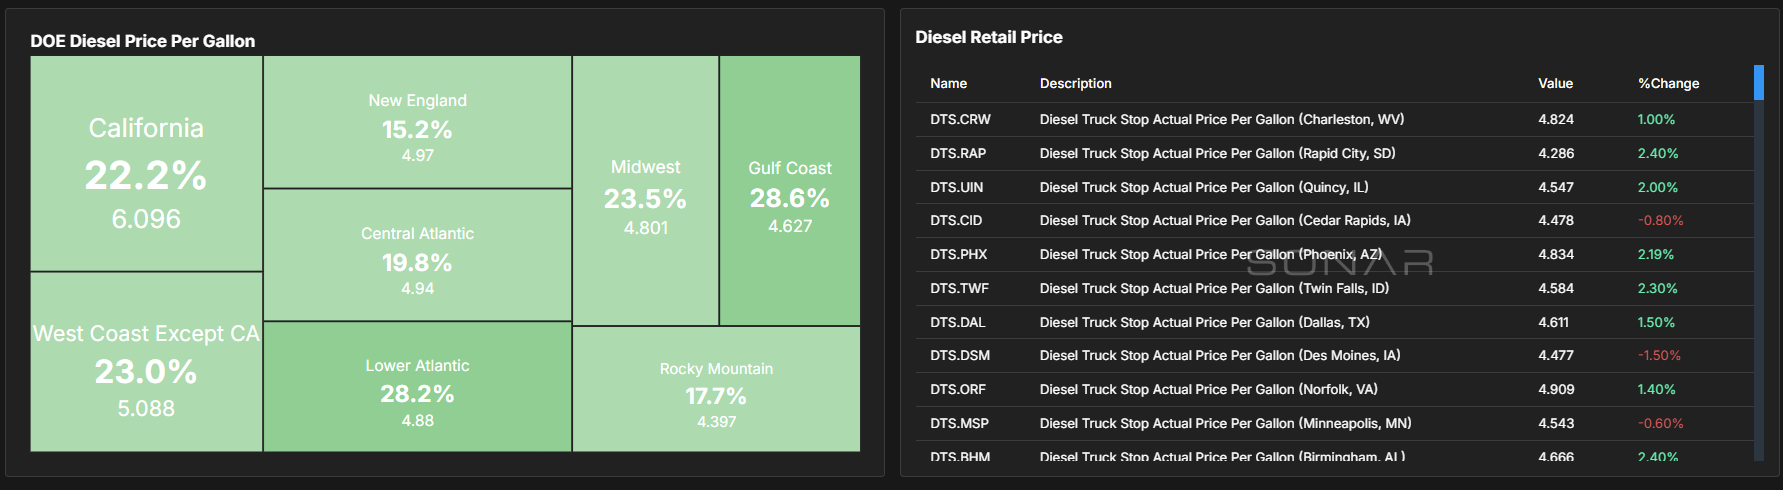
  • DOE National Diesel Price, a widely referenced benchmark used in fuel surcharge programs
  • Diesel Truck Stop Prices, reflecting real-world retail fuel costs paid by carriers
  • National and regional diesel price trends that signal changes in carrier operating costs

DOE, DTS Fuel Dashboard

These metrics help transportation professionals understand how fuel prices are evolving and how those changes may influence freight rates and carrier margins.

Fuel Market Pressure and Refining Signals

In addition to crude oil and diesel benchmarks, the dashboard incorporates related fuel markets that influence diesel supply.
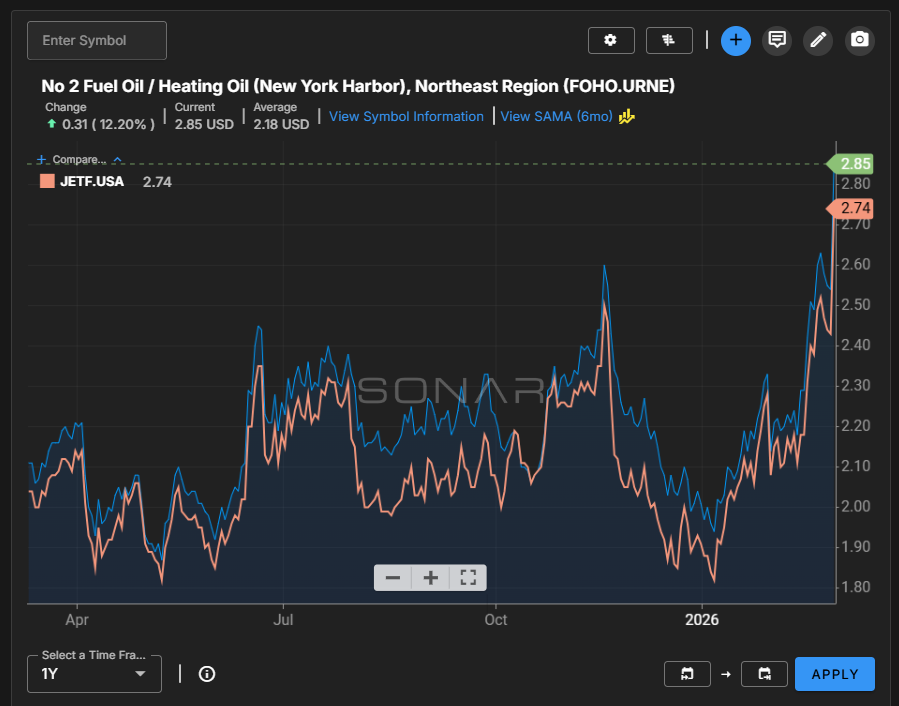
  • Heating Oil and Jet Fuel Indicators, which originate from the same refining middle distillate pool as diesel
  • Retail to Wholesale Fuel Spread, showing the difference between diesel truck stop prices and wholesale rack prices
  • Signals that may indicate refinery pressure, supply disruptions, or distribution constraints within fuel markets

Heating Oil, jet fuel - Fuel dashboard

These indicators help provide a more complete picture of fuel market dynamics and the forces that influence diesel pricing.

WHO IS INTERESTED?

Fuel costs can shift quickly and often influence transportation pricing across the entire freight market. Without clear visibility into energy markets, logistics teams may struggle to anticipate fuel-driven changes in costs and pricing.

The Fuel Dashboard brings the most important energy and diesel indicators together in one place, allowing users to quickly understand how fuel markets are evolving and how those changes may impact freight operations.

This provides several key advantages:

  • Real-time visibility into fuel market volatility
  • Early signals of diesel price changes and fuel surcharge adjustments
  • Identification of regional fuel cost pressure
  • Stronger understanding of how energy markets influence freight pricing

By connecting upstream energy signals with downstream transportation fuel pricing, the Fuel Dashboard helps transportation professionals stay ahead of fuel-driven market shifts and make more informed decisions about pricing, routing, and network strategy.

Search Knowledge Center

Other Supply Chain Intelligence (SCI) Features

KC-Icon-App-SCI-Summary

Network Optimization

KC-Icon-App-SCI-Opportunity

Benchmarking

KC-Icon-App-SCI-Network

Network Health

Choose Another App

carrier sales

Coverage Guide

KC-Icon-App-Critical-Events

Critical Events

Customer Sales.jpg

Sales Guide

Dashboards Icon

Dashboards

lane-signal-icon

Excel Add-In

KC-Icon-App-Market-Dashboard

Rate Intelligence

lane-scorecard-icon

Batch Rate Intelligence

container-atlas-icon

Most Volatile Markets

blue analytics icon

SCI: Custom Insights

imports-by-consignee-icon

SONAR Charts

KC-Icon-App-SCI-Summary

SONAR Maps

download-18

Supply Chain Intelligence (SCI)

predictive-rates-icon

Watchlists

Not Sure Where To Start?