Network Optimization

WHAT IS IT?

Network Optimization helps users move beyond individual lane performance and evaluate the broader markets and carriers driving transportation network results.

The section includes two primary views:

  • Network Analysis
  • Carrier Intelligence

Network Analysis groups transportation activity by market, while Carrier Intelligence evaluates carrier performance across the network and allows users to drill into the individual lanes each carrier services.

WHAT DOES IT TELL ME?

Network Analysis

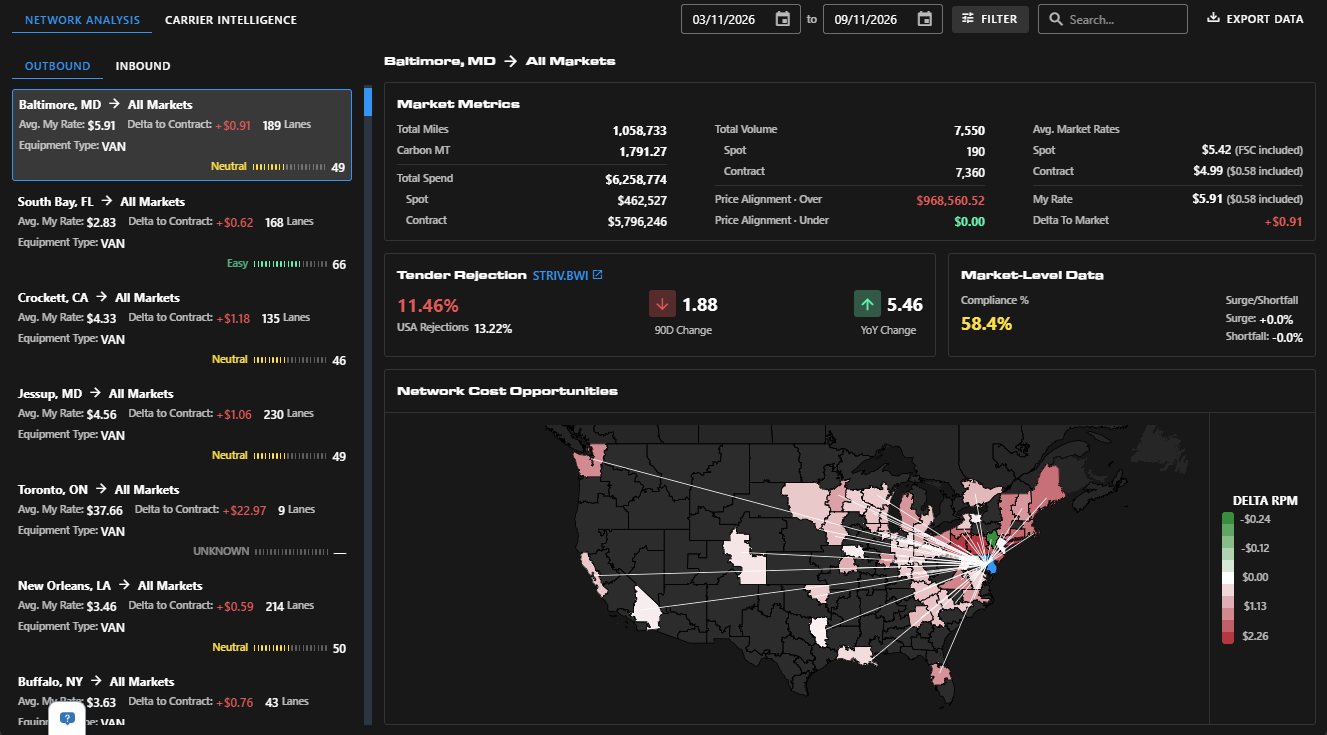
Network Analysis allows users to evaluate their network by origin or destination market.

For each selected market, users can review:

  • Total miles
  • Total transportation spend
  • Total volume
  • Spot and Contract activity
  • Average market rates
  • My Rate
  • Delta to Market
  • Price Alignment
  • Tender rejection conditions
  • Compliance
  • Surge or Shortfall

The Network Cost Opportunities Map shows the lanes connected to the selected market and helps visualize where transportation costs are above or below market.

This view helps answer:
  • Which facilities or markets are contributing the most transportation spend?
  • Which markets are consistently above or below market?
  • Where are current capacity conditions creating additional risk?
  • Which lanes are driving the performance of a specific market?

Carrier Intelligence

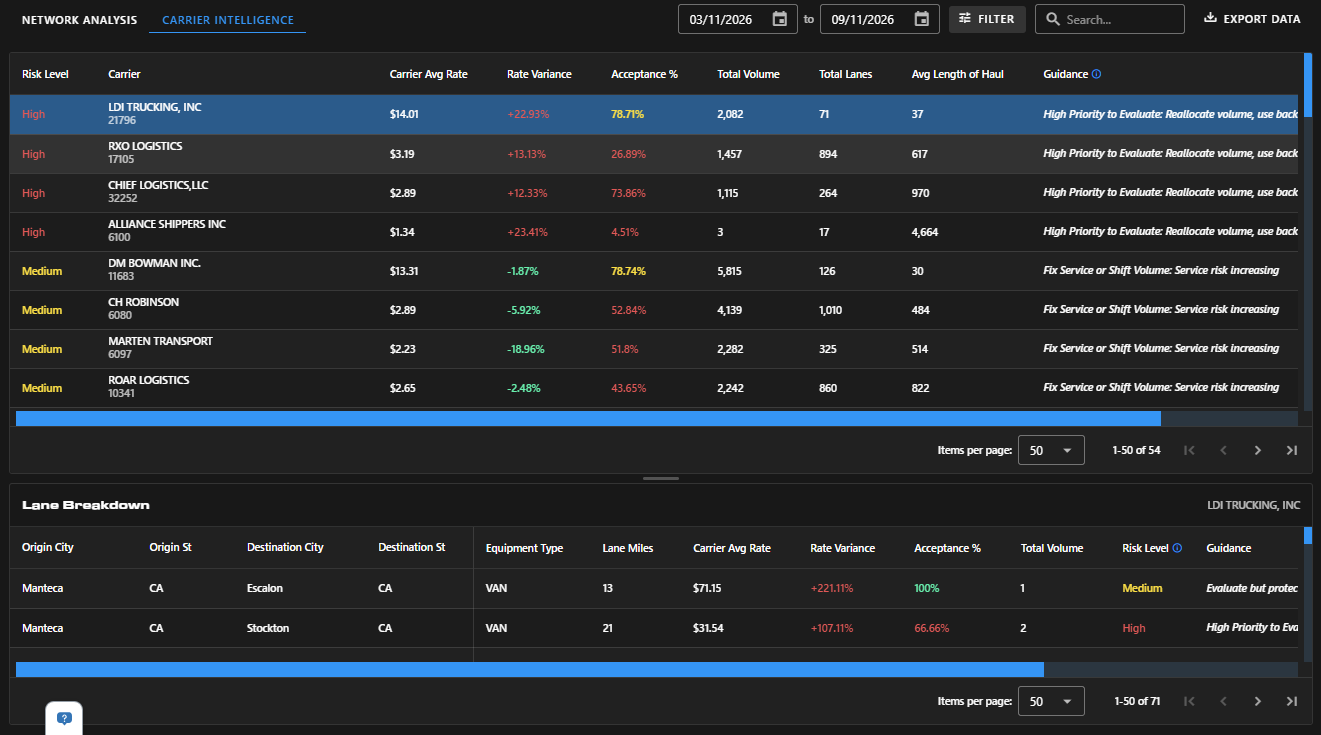
Carrier Intelligence provides a network-wide view of carrier performance.

Users can evaluate carriers using:

  • Risk Level
  • Carrier Average Rate
  • Rate Variance
  • Acceptance %
  • Total Volume
  • Total Lanes
  • Average Length of Haul
  • Guidance

Carrier Risk combines pricing and tender acceptance to help identify carriers that may require additional attention.

Users can select an individual carrier to see the lanes that carrier services and review lane-level pricing, acceptance, volume, risk, and guidance.

This view helps answer:
  • Which carriers are performing well across my network?
  • Which carriers are accepting the freight being tendered to them?
  • Which carriers have the greatest pricing variance?
  • Where is carrier performance creating service or cost risk?
  • Which individual lanes are driving a carrier’s overall performance?

WHO IS INTERESTED?

Network Optimization is most useful for:

  • Carrier management teams
  • Transportation procurement
  • Network optimization teams
  • Transportation and logistics managers
  • Supply chain analysts
  • Operations leadership
  • Teams preparing for carrier reviews or QBRs

Search Knowledge Center

Other Supply Chain Intelligence (SCI) Features

KC-Icon-App-SCI-Opportunity

Benchmarking

KC-Icon-App-SCI-Network

Network Health

Choose Another App

carrier sales

Coverage Guide

KC-Icon-App-Critical-Events

Critical Events

Customer Sales.jpg

Sales Guide

Dashboards Icon

Dashboards

lane-signal-icon

Excel Add-In

KC-Icon-App-Market-Dashboard

Rate Intelligence

lane-scorecard-icon

Batch Rate Intelligence

container-atlas-icon

Most Volatile Markets

blue analytics icon

SCI: Custom Insights

imports-by-consignee-icon

SONAR Charts

KC-Icon-App-SCI-Summary

SONAR Maps

download-18

Supply Chain Intelligence (SCI)

predictive-rates-icon

Watchlists

Not Sure Where To Start?