Carrier Safety Dashboard

WHAT IS IT?

The Carrier Safety Dashboard gives users a centralized view of FMCSA crash, inspection, violation, carrier and census data across the U.S. road transportation market. Instead of reviewing safety data across multiple sources, users can monitor key risk indicators, compare activity across states and better understand where safety, compliance or carrier exposure may be concentrated.

The dashboard is designed to help teams evaluate transportation risk, monitor regulatory trends and add safety context to carrier network, market and operational decisions.

WHAT DOES IT TELL ME?

Crashes
The Crashes page helps users understand where safety incidents are occurring, how severe they are and which states may carry higher exposure.
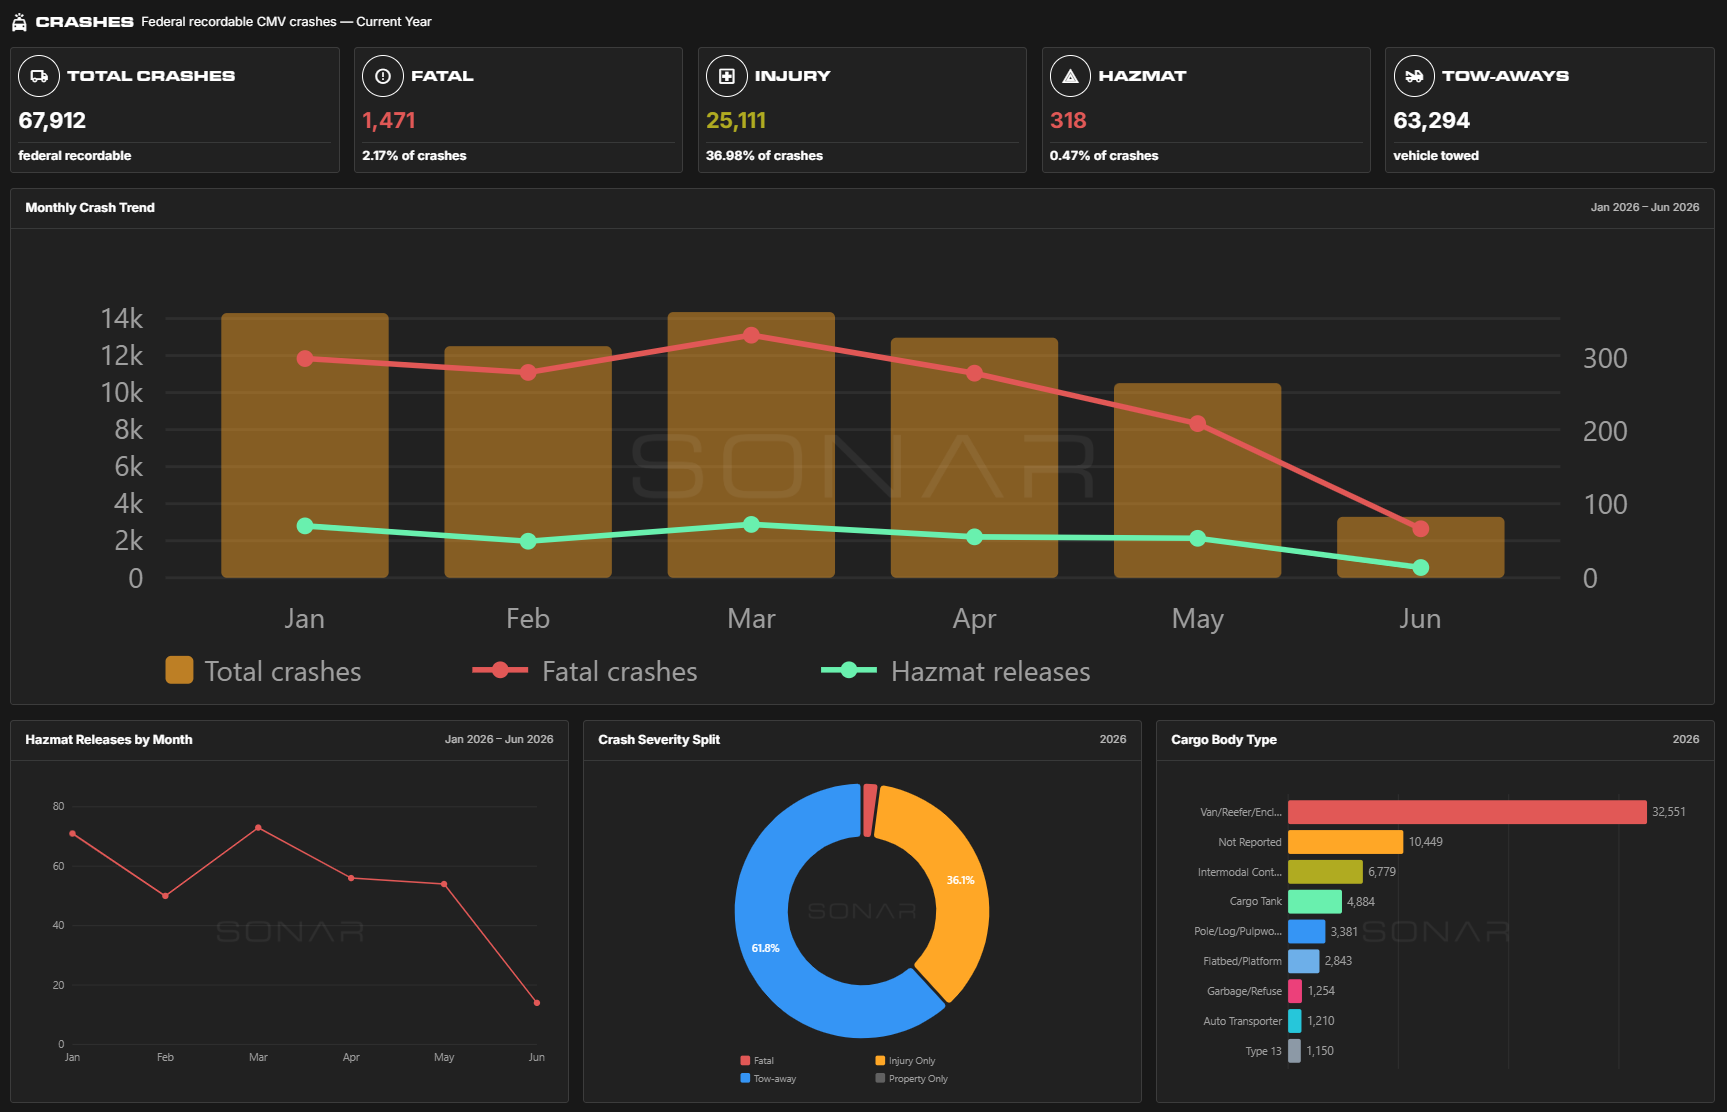
  • Identify states and regions with higher crash concentration
  • Monitor crash activity and trends over time
  • Evaluate severity mix across fatal, injury and towaway crashes
  • Understand hazmat-related crash exposure by state
  • Add safety incident context to carrier, lane and regional risk analysis


Carriers & Census

The Carriers & Census page helps users understand the active carrier population and how registered carrier operations are distributed across the market.
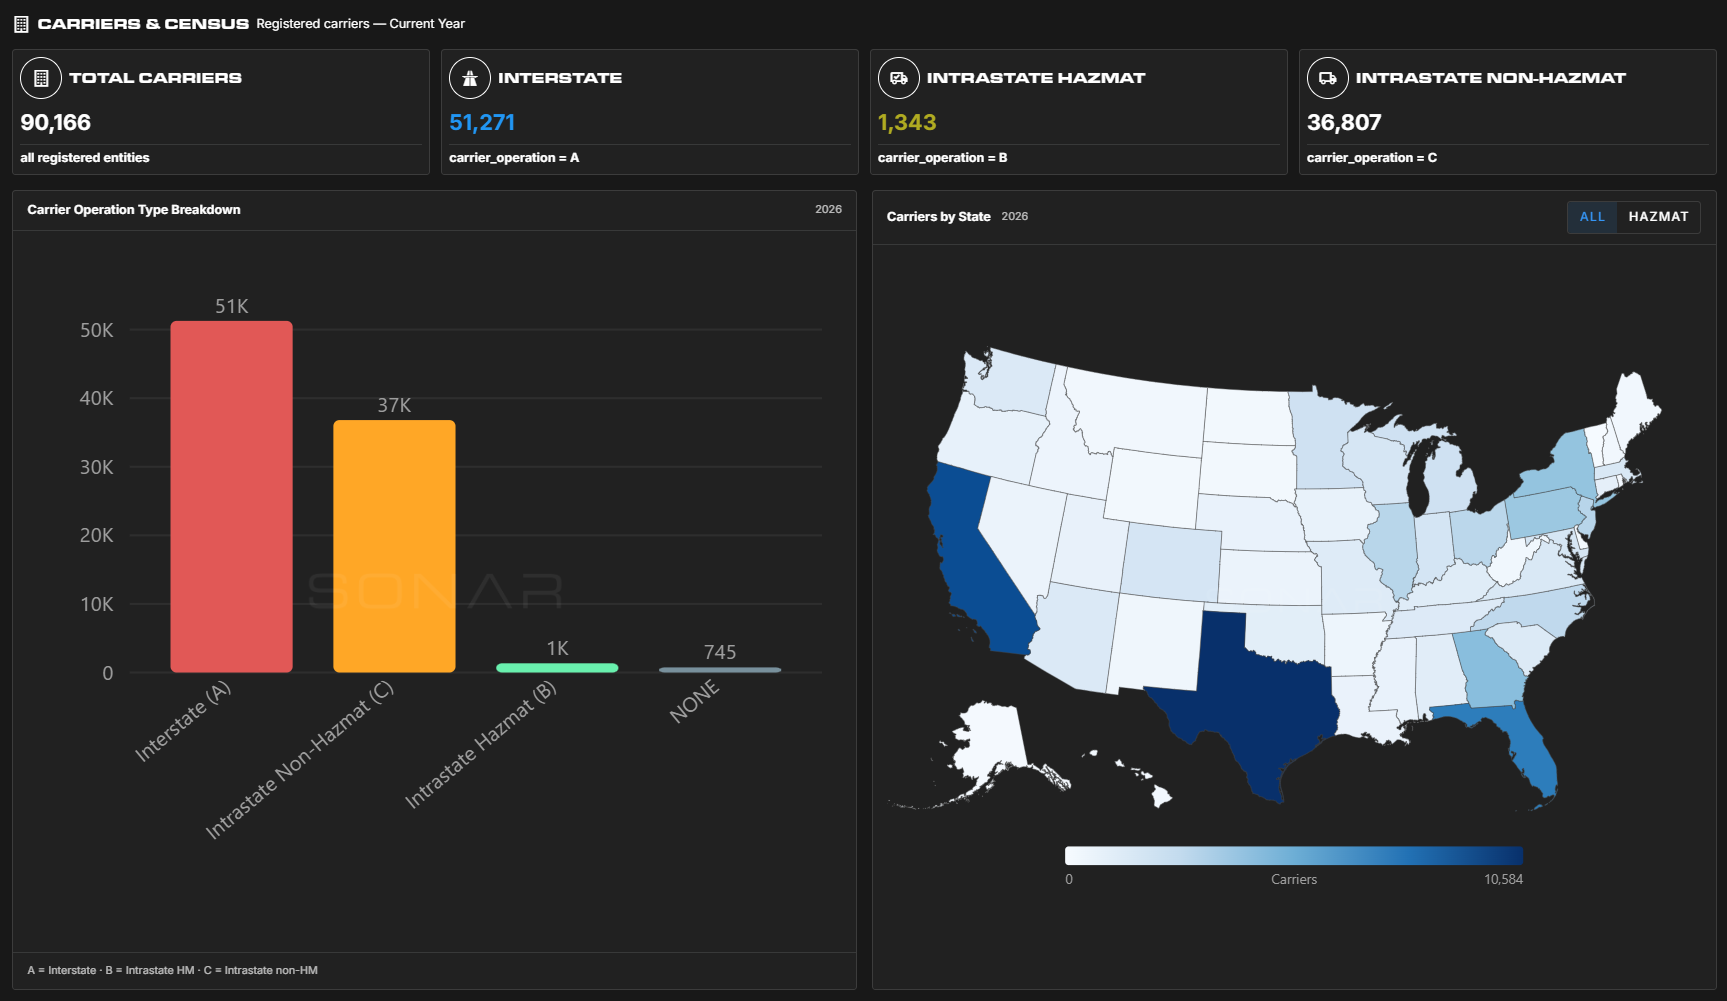
  • Monitor changes in the registered carrier population
  • Understand carrier concentration by state
  • Compare interstate and intrastate operating authority trends
  • Identify where hazmat carrier exposure is more concentrated
  • Add carrier population context to network planning and market analysis


Inspections & Violations

The Inspections & Violations page gives users visibility into enforcement activity and out-of-service trends across the market. By combining inspection volume, violation activity, hazmat violations and OOS detail, users can better understand where compliance pressure is elevated and which violation categories are contributing most to risk.
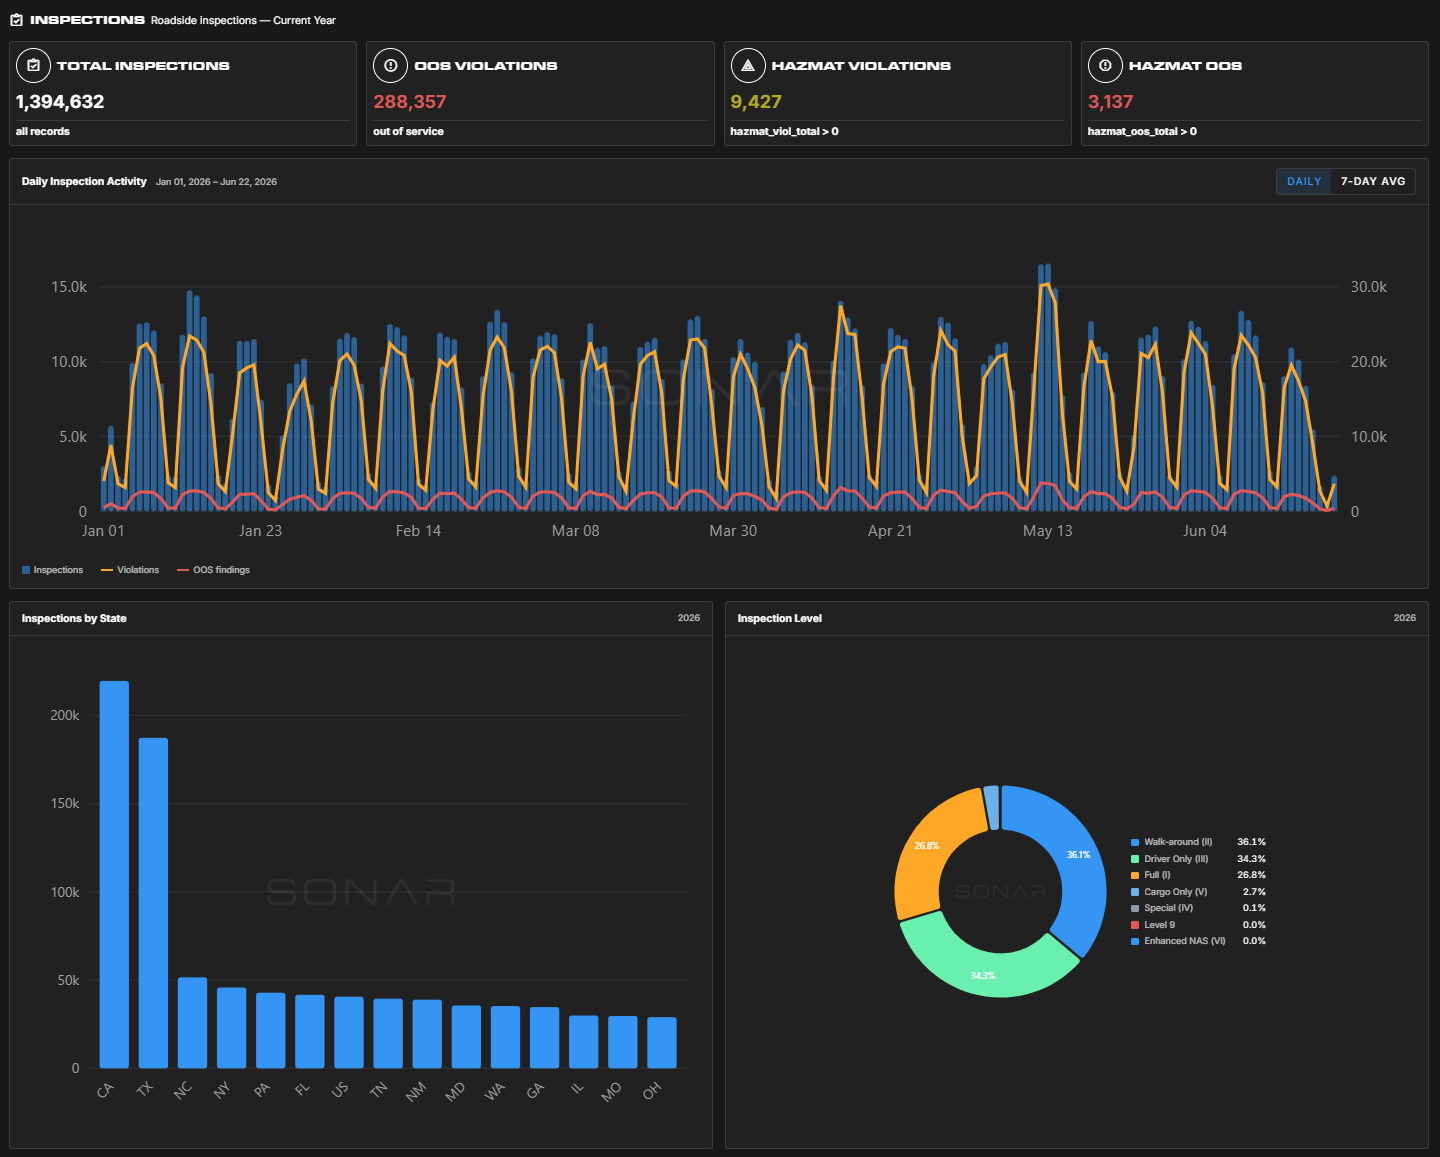

  • Track inspection and OOS activity across time and geography
  • Identify states with higher inspection volume or OOS concentrations
  • Understand the violation categories most often tied to OOS outcomes
  • Review hazmat inspection and violation trends for added risk visibility
  • Support compliance, carrier review and safety monitoring workflows


HOW TO USE IT

The Carrier Safety Dashboard gives teams a faster way to connect safety, compliance and carrier activity in one view. It can support workflows such as:

  • Monitoring state-level transportation risk
  • Tracking crash, inspection and OOS trends over time
  • Identifying regions with elevated hazmat exposure
  • Supporting compliance and risk-management discussions
  • Benchmarking market activity against FMCSA safety indicators

Search Knowledge Center

Other Supply Chain Intelligence (SCI) Features

KC-Icon-App-SCI-Summary

Network Optimization

KC-Icon-App-SCI-Opportunity

Benchmarking

KC-Icon-App-SCI-Network

Network Health

Choose Another App

carrier sales

Coverage Guide

KC-Icon-App-Critical-Events

Critical Events

Customer Sales.jpg

Sales Guide

Dashboards Icon

Dashboards

lane-signal-icon

Excel Add-In

KC-Icon-App-Market-Dashboard

Rate Intelligence

lane-scorecard-icon

Batch Rate Intelligence

container-atlas-icon

Most Volatile Markets

blue analytics icon

SCI: Custom Insights

imports-by-consignee-icon

SONAR Charts

KC-Icon-App-SCI-Summary

SONAR Maps

download-18

Supply Chain Intelligence (SCI)

predictive-rates-icon

Watchlists

Not Sure Where To Start?