Monthly Market Update Dashboard

WHAT IS IT?

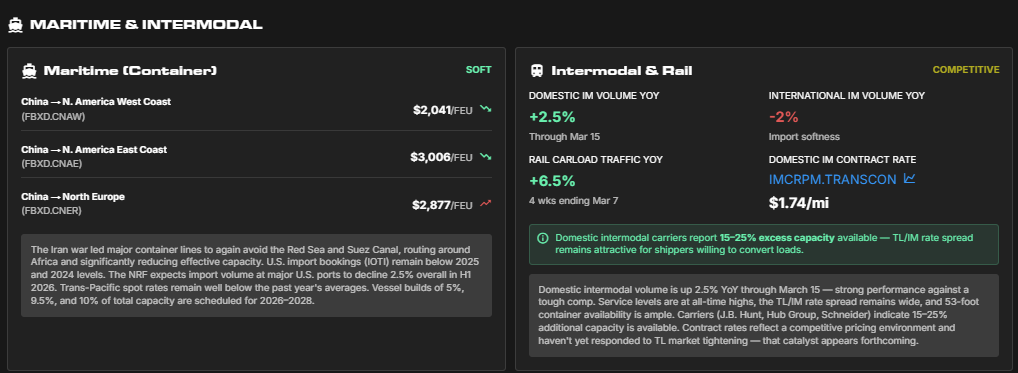
The Monthly Market Update is SONAR’s comprehensive view of the freight market, combining macroeconomic trends, industry activity, and mode-specific insights across truckload, intermodal, maritime, and beyond. Delivered each month, it connects what’s happening in the broader economy to how freight demand, capacity, and pricing are evolving. Now available as a dashboard, this same trusted analysis is easier to explore, monitor, and act on in real time.

WHAT DOES IT TELL ME?

By connecting macro trends like inflation, fuel, and industrial activity to real-time freight signals such as rejection rates, volumes, and spot rates, your team can better anticipate shifts instead of reacting to them. The Monthly Market Update dashboard provides:
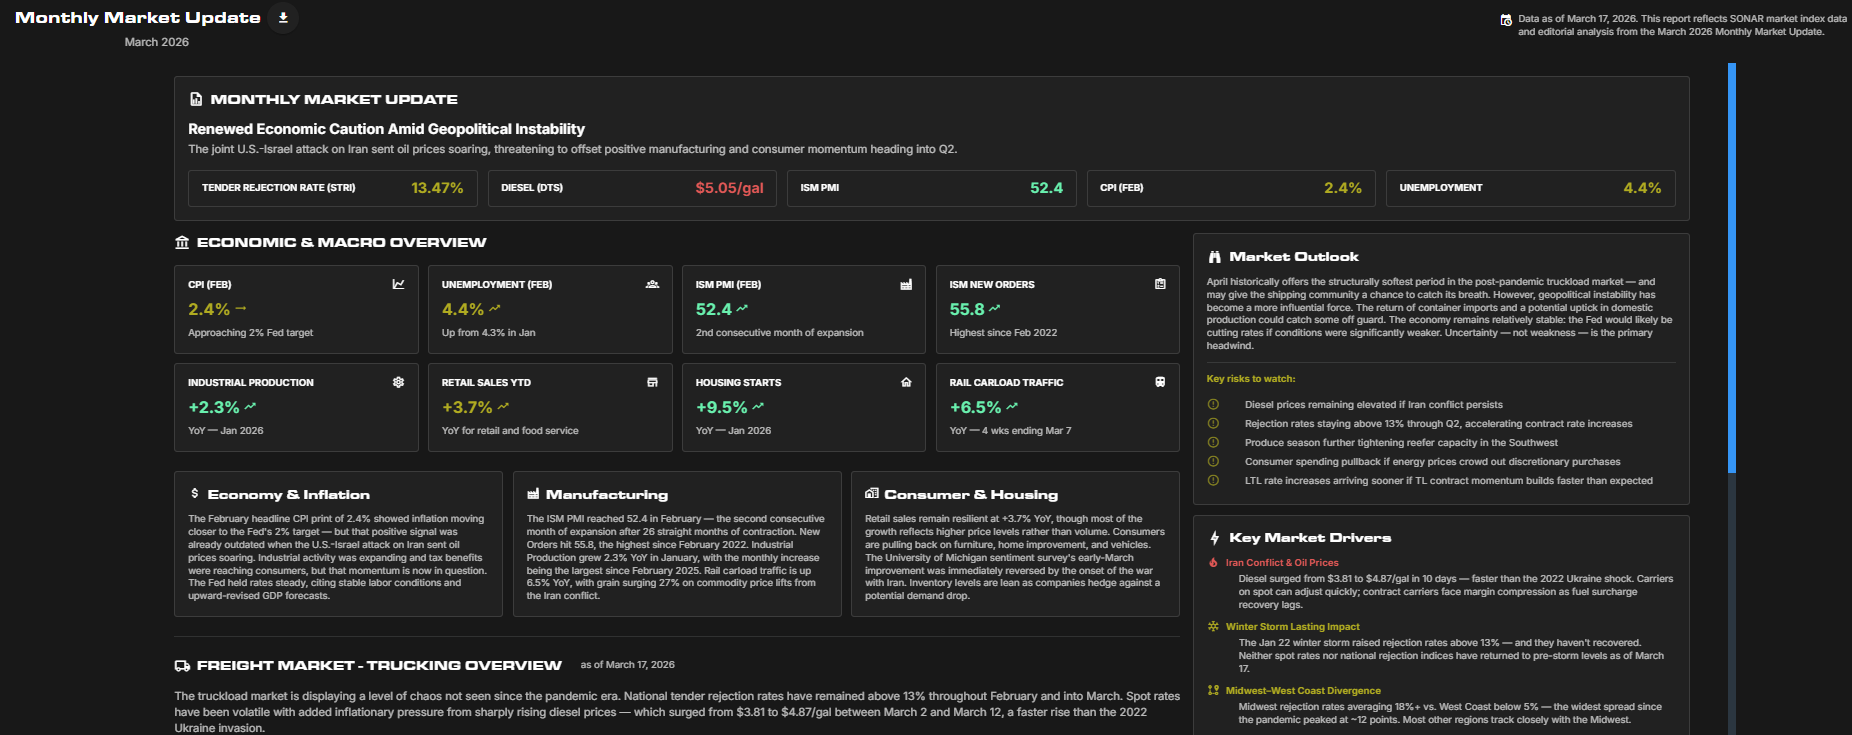
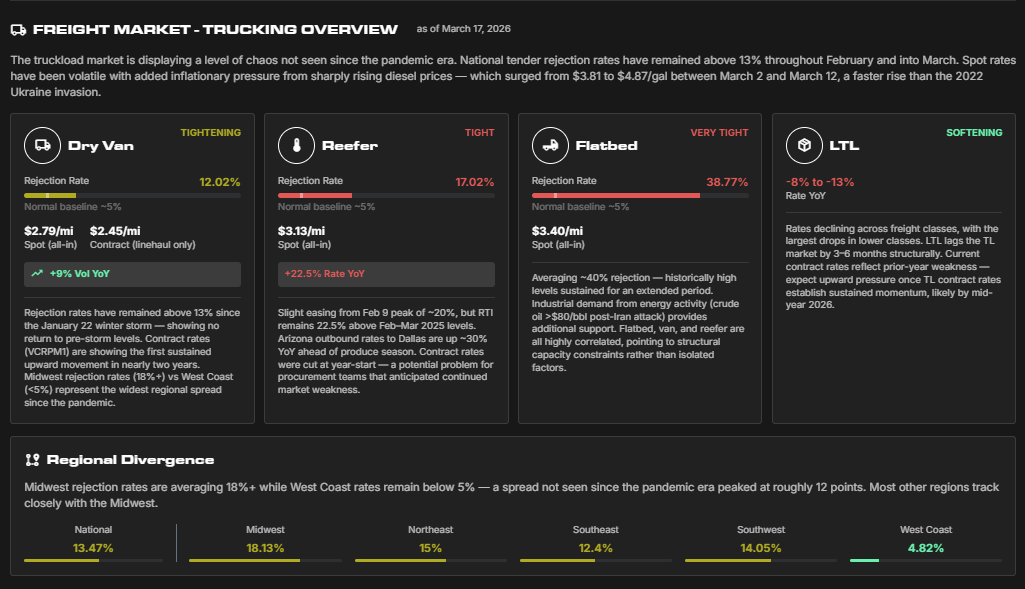
  • All-in-one market view: A single place to track economic indicators, manufacturing trends, consumer activity, and freight market performance without switching between tools
  • Mode-specific visibility: Break down conditions across truckload, intermodal, maritime, and LTL to understand how each segment is moving and why
  • Integrated charts and data: Every insight is backed by SONAR data and visualized through interactive charts you can explore further
  • Structured, repeatable format: Consistent monthly framework makes it easy to track trends over time and quickly identify what’s changing


WHO IS INTERESTED?

  • Shippers: Teams responsible for procurement, budgeting, and network planning that need a clear view of how market conditions are shifting
  • Brokers: Pricing and sales teams looking to stay ahead of rate movements, capacity changes, and regional imbalances
  • Carriers: Strategy and operations teams monitoring demand trends, network positioning, and opportunities across markets
  • Freight analysts & leadership teams: Anyone responsible for understanding the broader market and aligning teams around a consistent, data-backed view of conditions

HOW TO USE IT

Use the dashboard as a starting point for your weekly and monthly workflows. Begin with the high-level summary to understand the current market narrative, then drill into specific modes, regions, or indicators that impact your business most.

Teams that revisit these trends regularly are better positioned to spot changes early, adjust strategies faster, and stay aligned across pricing, procurement, and operations.

Search Knowledge Center

Other Supply Chain Intelligence (SCI) Features

KC-Icon-App-SCI-Summary

Network Optimization

KC-Icon-App-SCI-Opportunity

Benchmarking

KC-Icon-App-SCI-Network

Network Health

Choose Another App

carrier sales

Coverage Guide

KC-Icon-App-Critical-Events

Critical Events

Customer Sales.jpg

Sales Guide

Dashboards Icon

Dashboards

lane-signal-icon

Excel Add-In

KC-Icon-App-Market-Dashboard

Rate Intelligence

lane-scorecard-icon

Batch Rate Intelligence

container-atlas-icon

Most Volatile Markets

blue analytics icon

SCI: Custom Insights

imports-by-consignee-icon

SONAR Charts

KC-Icon-App-SCI-Summary

SONAR Maps

download-18

Supply Chain Intelligence (SCI)

predictive-rates-icon

Watchlists

Not Sure Where To Start?