Ocean and Air Rates Dashboard

WHAT IS IT?

The Ocean and Air Rates Dashboard, provides global visibility into international freight pricing across major ocean and air cargo markets. Built through SONAR’s integration with Freightos, this dashboard brings real-time international rate intelligence directly into SONAR so logistics professionals can track pricing trends across key global trade lanes.

International freight markets are highly dynamic, influenced by shifting demand, geopolitical disruptions, fuel costs, and carrier capacity changes. The Ocean and Air Rates Dashboard helps users stay ahead of these changes by consolidating global rate indices and custom route-level pricing into one unified view.

By combining ocean and air freight pricing with SONAR’s broader freight intelligence ecosystem, the dashboard allows users to monitor global transportation costs, evaluate routing options, and better anticipate shifts in international supply chain dynamics.

WHAT DOES IT TELL ME?

The Ocean and Air Rates Dashboard provides visibility into international freight pricing trends, trade lane dynamics, and global transportation market conditions.

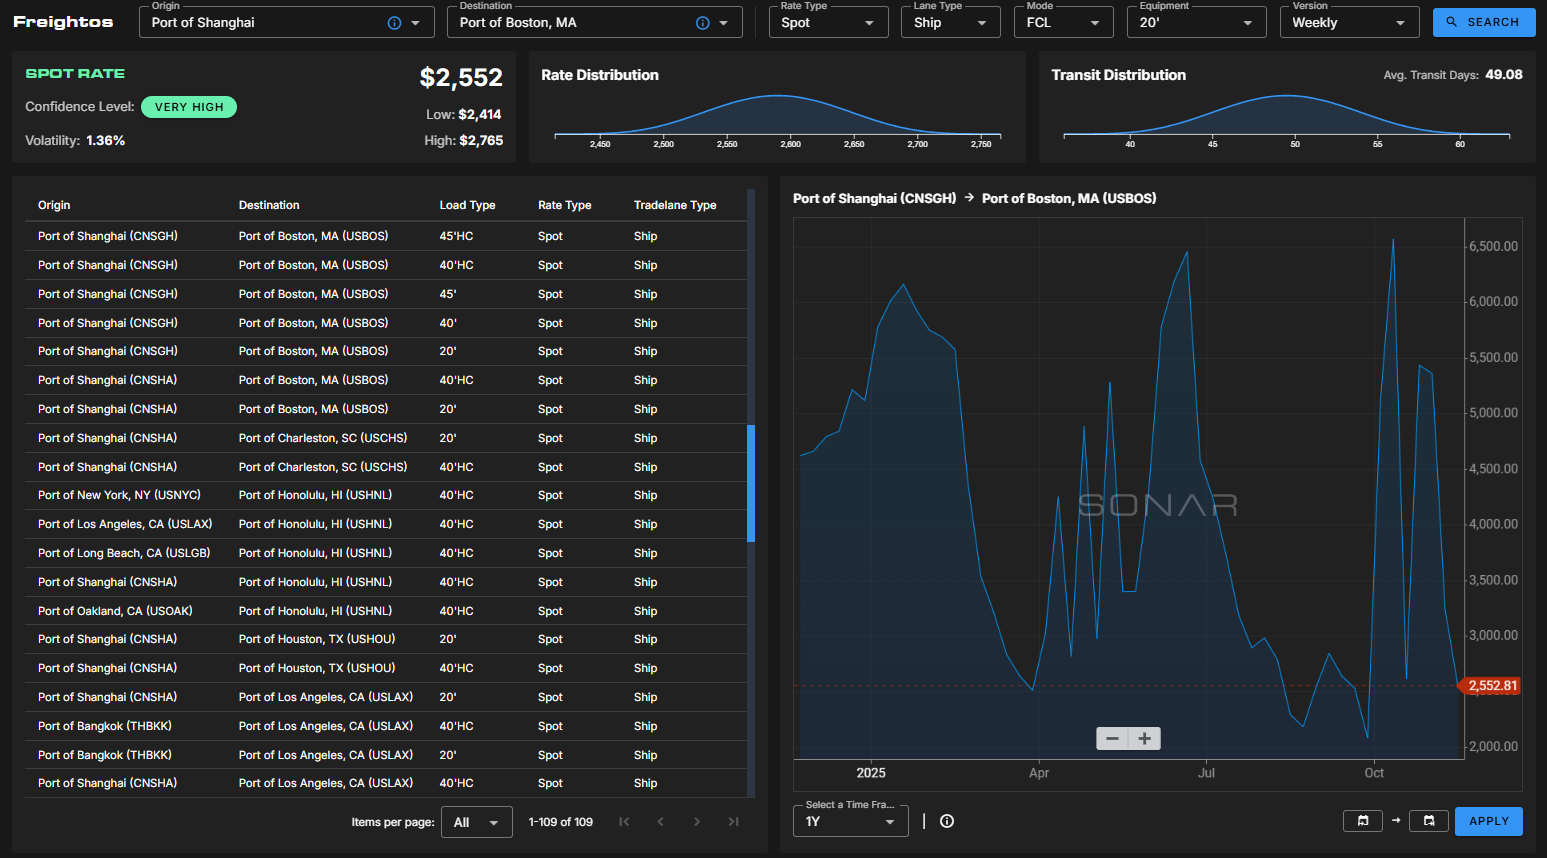
Custom Route-Level Pricing

Provide detailed pricing insights across specific port-to-port and airport-to-airport routes.

  • Custom air and ocean route pricing based on specific trade lane pairings
  • Visibility into price ranges (min, max, average) across routes
  • Detailed surcharge breakdowns including fuel, currency adjustments, and seasonal fees
  • Route-level cost transparency to evaluate contract competitiveness and market alignment

This allows users to analyze not just global indices, but the actual routes most relevant to their network.

WHO IS INTERESTED?

International freight markets can shift quickly, and relying on outdated benchmarks or limited pricing visibility can expose supply chains to unexpected costs and disruptions.

The Ocean and Air Rates Dashboard brings global rate intelligence into SONAR, giving logistics teams a clearer view of how international markets are evolving, through:

  • Real-time visibility into global ocean and air freight pricing
  • Better insight into international supply chain cost pressures
  • Stronger negotiation leverage with carriers and forwarders
  • Improved planning for routing, procurement, and transportation strategy

By tracking detailed route-level pricing, the Ocean and Air Rates Dashboard helps organizations anticipate market movement rather than react to it, enabling more confident decision-making in an increasingly volatile global freight environment.

Search Knowledge Center

Other Supply Chain Intelligence (SCI) Features

KC-Icon-App-SCI-Summary

Network Optimization

KC-Icon-App-SCI-Opportunity

Benchmarking

KC-Icon-App-SCI-Network

Network Health

Choose Another App

carrier sales

Coverage Guide

KC-Icon-App-Critical-Events

Critical Events

Customer Sales.jpg

Sales Guide

Dashboards Icon

Dashboards

lane-signal-icon

Excel Add-In

KC-Icon-App-Market-Dashboard

Rate Intelligence

lane-scorecard-icon

Batch Rate Intelligence

container-atlas-icon

Most Volatile Markets

blue analytics icon

SCI: Custom Insights

imports-by-consignee-icon

SONAR Charts

KC-Icon-App-SCI-Summary

SONAR Maps

download-18

Supply Chain Intelligence (SCI)

predictive-rates-icon

Watchlists

Not Sure Where To Start?