Intermodal Dashboard

WHAT IS IT?

The Intermodal Dashboard is a pre-built SONAR dashboard designed to help transportation and supply chain professionals evaluate when rail/intermodal may be a more efficient alternative to truckload transportation.

Mode selection decisions are often influenced by cost, capacity, transit time, and market conditions. The Intermodal Dashboard simplifies these decisions by consolidating truckload, intermodal, and maritime data into one unified view. By connecting these datasets together, the dashboard highlights where intermodal may offer cost advantages and where shifting freight between modes could improve overall network efficiency.

Rather than relying on assumptions or static pricing comparisons, the Intermodal Dashboard provides lane-level market intelligence so users can evaluate real market conditions and make more informed mode decisions.

WHAT DOES IT TELL ME?

The Intermodal Dashboard provides visibility into rate differences, freight volumes, and potential savings opportunities across truckload and intermodal transportation.

Rate Comparison Across Modes

One of the core capabilities of the dashboard is comparing transportation costs between truckload and rail.
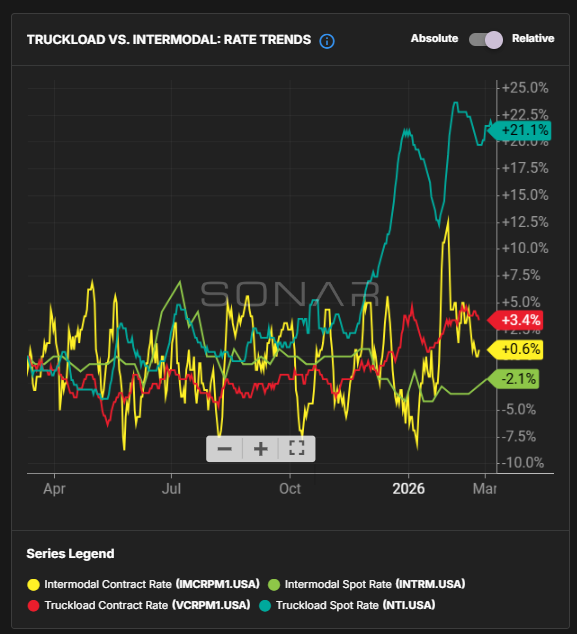
  • Spot and Contract Rate Tracking showing truckload and intermodal pricing trends side-by-side
  • Visibility into how cost differences between modes change over time
  • The ability to identify periods where intermodal offers meaningful cost advantages

This allows transportation teams to quickly evaluate when shifting freight to intermodal may reduce transportation costs.

Volume and Demand Visibility

Understanding demand trends is essential when evaluating modal shifts. The dashboard incorporates several indicators to provide additional market context:
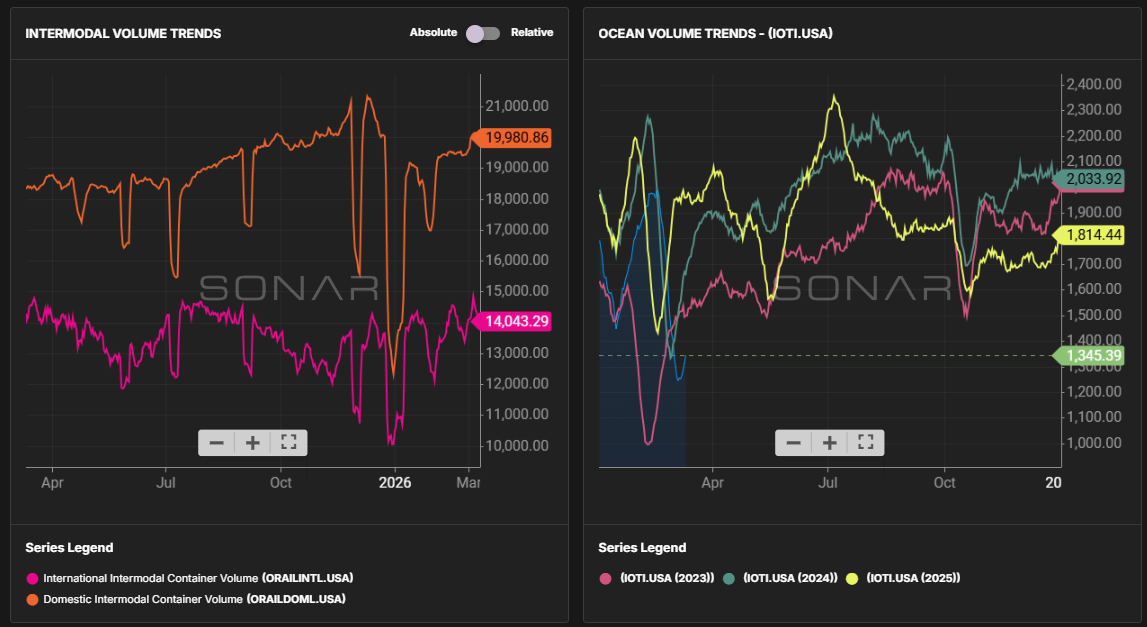
  • Domestic and international intermodal volume trends
  • Maritime import booking data to provide a forward-looking signal of container demand entering the U.S.
  • Indicators that help identify future intermodal demand and potential capacity shifts

By connecting global freight signals with inland rail activity, users can better anticipate when intermodal demand may increase.

Lane-Level Mode Optimization

The dashboard also includes tools designed to highlight specific lanes where intermodal could be a viable alternative to truckload.
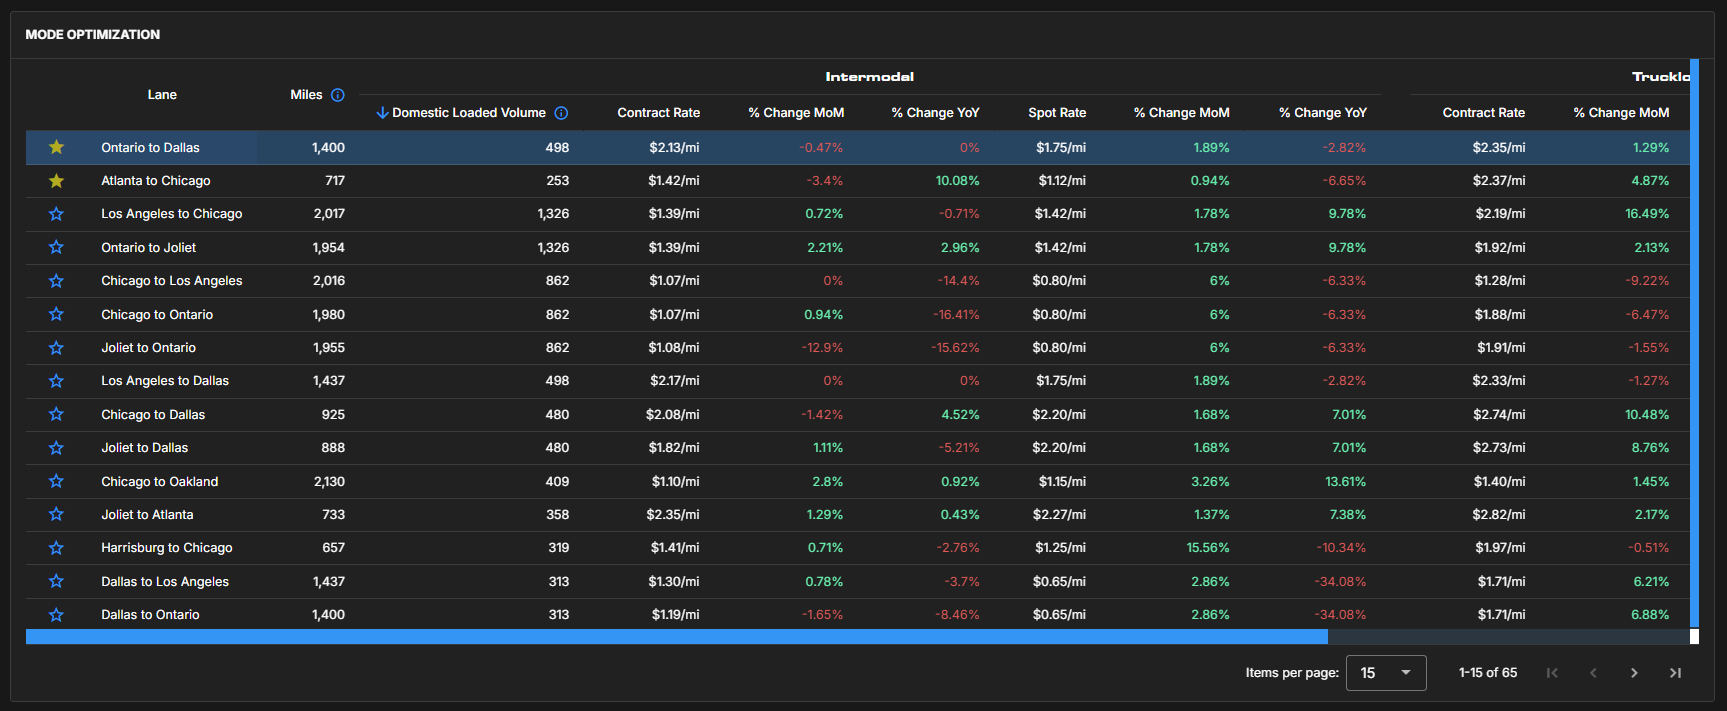
  • A Mode Optimization Table showing lane-level truckload versus rail comparisons
  • Contract Savings Percentage, highlighting potential cost reductions from intermodal conversion
  • Clear visibility into lanes where intermodal capacity may be underutilized

These insights help users move beyond high-level market signals and focus on actionable opportunities within their network.


WHO IS INTERESTED?

The Intermodal Dashboard helps transportation teams make smarter, data-driven decisions about how freight moves across their network.

Instead of evaluating modal options manually or relying on limited historical data, users gain a consolidated view of rates, volumes, and savings opportunities across modes.

  • Clear visibility into truckload versus intermodal cost dynamics
  • Identification of lanes where intermodal may reduce transportation spend
  • Improved network efficiency through smarter mode selection
  • Data-backed support for intermodal conversion strategies

By bringing truckload, intermodal, and maritime signals together into one view, the Intermodal Dashboard enables supply chain teams to confidently optimize their freight strategy and uncover opportunities to reduce transportation costs while maintaining service reliability.

Search Knowledge Center

Other Supply Chain Intelligence (SCI) Features

KC-Icon-App-SCI-Summary

Network Optimization

KC-Icon-App-SCI-Opportunity

Benchmarking

KC-Icon-App-SCI-Network

Network Health

Choose Another App

carrier sales

Coverage Guide

KC-Icon-App-Critical-Events

Critical Events

Customer Sales.jpg

Sales Guide

Dashboards Icon

Dashboards

lane-signal-icon

Excel Add-In

KC-Icon-App-Market-Dashboard

Rate Intelligence

lane-scorecard-icon

Batch Rate Intelligence

container-atlas-icon

Most Volatile Markets

blue analytics icon

SCI: Custom Insights

imports-by-consignee-icon

SONAR Charts

KC-Icon-App-SCI-Summary

SONAR Maps

download-18

Supply Chain Intelligence (SCI)

predictive-rates-icon

Watchlists

Not Sure Where To Start?