Regional Trade Analysis

WHAT IS IT?

The Regional Trade Analysis dashboard provides a focused view of how global freight volumes move between major international regions and how those movements influence supply chains. It helps users track changes to global trade patters, geopolitical tensions, evolving trade policies and changing economic conditions by highlighting key trade lanes and regional freight activity across major global markets.

This dashboard expands on the Trade War Command Center by breaking down global freight flows into regional trade corridors, allowing users to quickly identify where volumes are increasing, declining, or shifting between markets.

Currently, the dashboard highlights trade activity across several major global regions including:

  • Europe
  • Middle East & North Africa
  • East Asia
  • Southeast Asia

By isolating these key regions, the dashboard makes it easier to monitor international trade flows and understand how regional dynamics influence global freight markets.

WHAT DOES IT TELL ME?

The Regional Trade Analysis dashboard provides visibility into how freight is moving across global trade lanes and how those shifts may impact supply chains, capacity, and transportation demand.

International Trade Lane Activity

The dashboard highlights freight movements across major international corridors, helping users understand where global trade demand is strengthening or weakening.
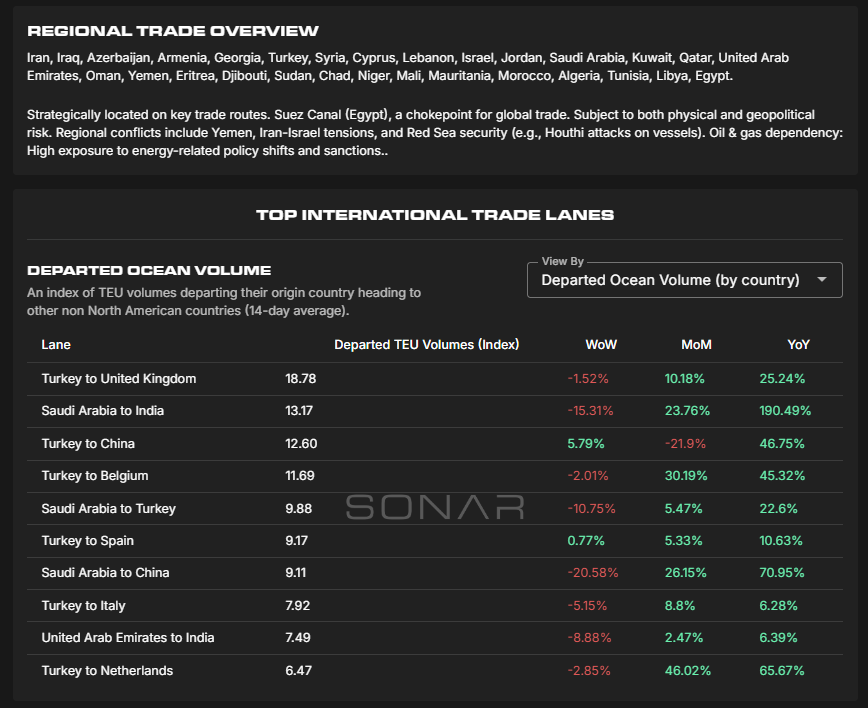
  • Inbound Ocean Volumes across major international trade lanes to track container flows entering key markets
  • Regional trade activity comparisons to identify where freight demand is shifting geographically
  • Trade lane trends that reveal how geopolitical events or policy changes influence global freight routing

These signals help users identify whether freight is rerouting between regions or concentrating in certain trade corridors.

Intermodal and Inland Freight Signals

Global freight movements ultimately impact inland transportation networks. The dashboard incorporates additional indicators such as:
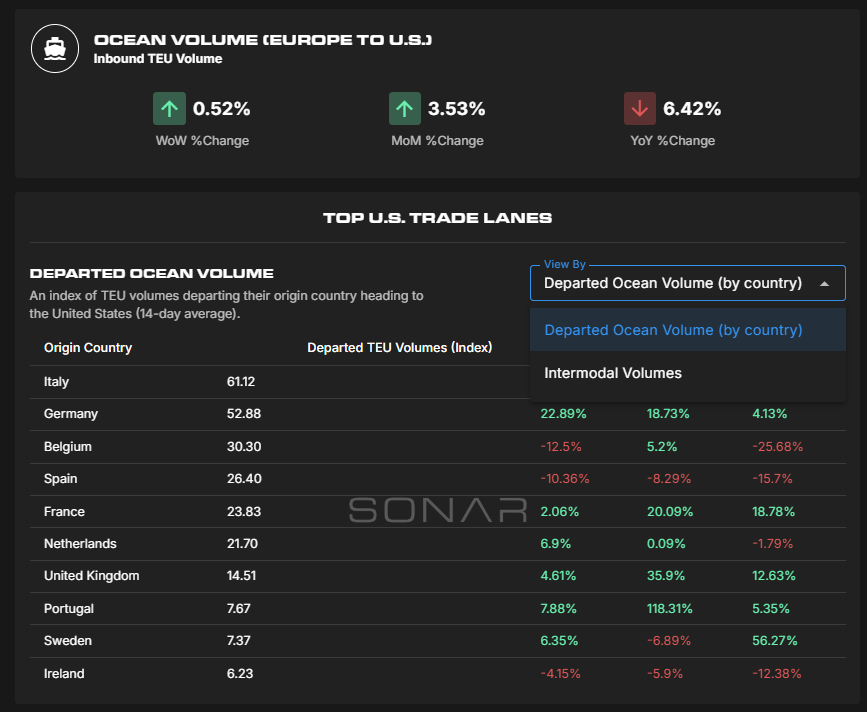
  • Intermodal volumes to track container flows transitioning from ports into inland rail networks
  • Regional freight activity trends that reveal how international trade influences domestic transportation demand


These metrics help connect global shipping activity with inland logistics networks, offering a clearer picture of how trade flows translate into transportation demand.

Regional Supply Chain Dynamics

By organizing freight flows by global region, the dashboard allows users to monitor:
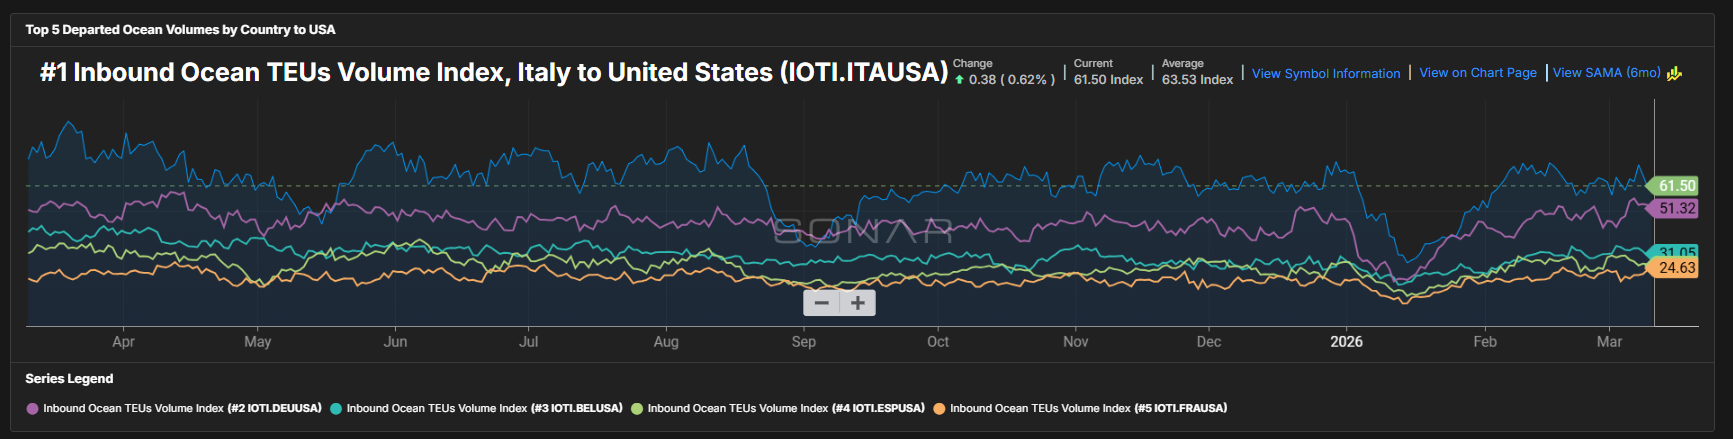
  • Emerging supply chain shifts between region lanes
  • Changes in sourcing patterns and trade routes
  • Regional demand signals that may impact transportation planning

This regional view helps organizations understand not just how much freight is moving, but where the global supply chain is evolving.


WHO IS INTERESTED?

Instead of monitoring individual trade indicators or reacting to geopolitical headlines, users gain structured insight into how freight is moving between key regions and how those movements influence supply chains.

  • Early visibility into global supply chain shifts
  • Better understanding of changing sourcing and trade lane activity
  • Improved planning for transportation, procurement, and logistics strategy
  • Clear insight into how international freight flows influence inland transportation networks

By combining ocean trade flows, regional freight indicators, and intermodal activity in a single view, the Regional Trade Analysis dashboard helps teams stay ahead of evolving global supply chain dynamics and make more informed decisions about routing, capacity, and market strategy.

Search Knowledge Center

Other Supply Chain Intelligence (SCI) Features

KC-Icon-App-SCI-Summary

Network Optimization

KC-Icon-App-SCI-Opportunity

Benchmarking

KC-Icon-App-SCI-Network

Network Health

Choose Another App

carrier sales

Coverage Guide

KC-Icon-App-Critical-Events

Critical Events

Customer Sales.jpg

Sales Guide

Dashboards Icon

Dashboards

lane-signal-icon

Excel Add-In

KC-Icon-App-Market-Dashboard

Rate Intelligence

lane-scorecard-icon

Batch Rate Intelligence

container-atlas-icon

Most Volatile Markets

blue analytics icon

SCI: Custom Insights

imports-by-consignee-icon

SONAR Charts

KC-Icon-App-SCI-Summary

SONAR Maps

download-18

Supply Chain Intelligence (SCI)

predictive-rates-icon

Watchlists

Not Sure Where To Start?