Executive Dashboard

WHAT IS IT?

The Executive Dashboard delivers an instant, powerful high-level view of the freight market as soon as you log into SONAR. It brings together volume demand trends, rate and capacity shifts, and macroeconomic context that highlight what matters most.

WHAT DOES IT TELL ME?


Unified Market Overview: Brings together Rates & Capacity, Volume Demand and Economic Indicators, each with market summaries, high-level charts, and easy drill-downs.
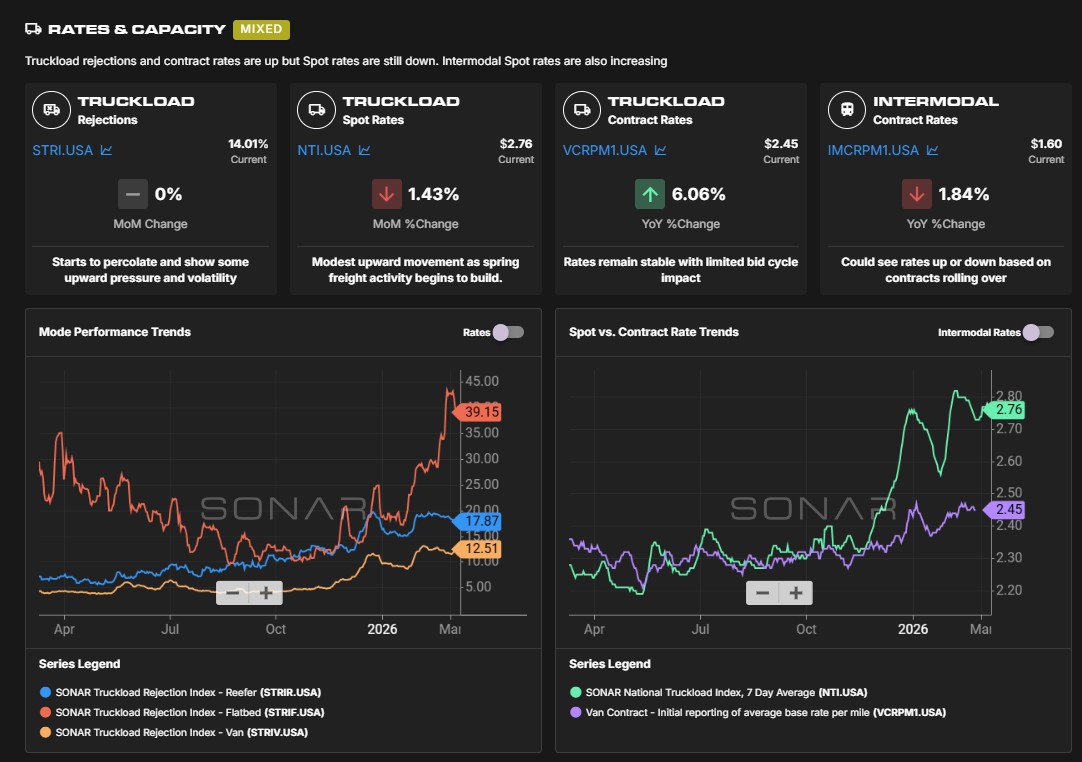
Rates and Capacity section on Executive Dashboard

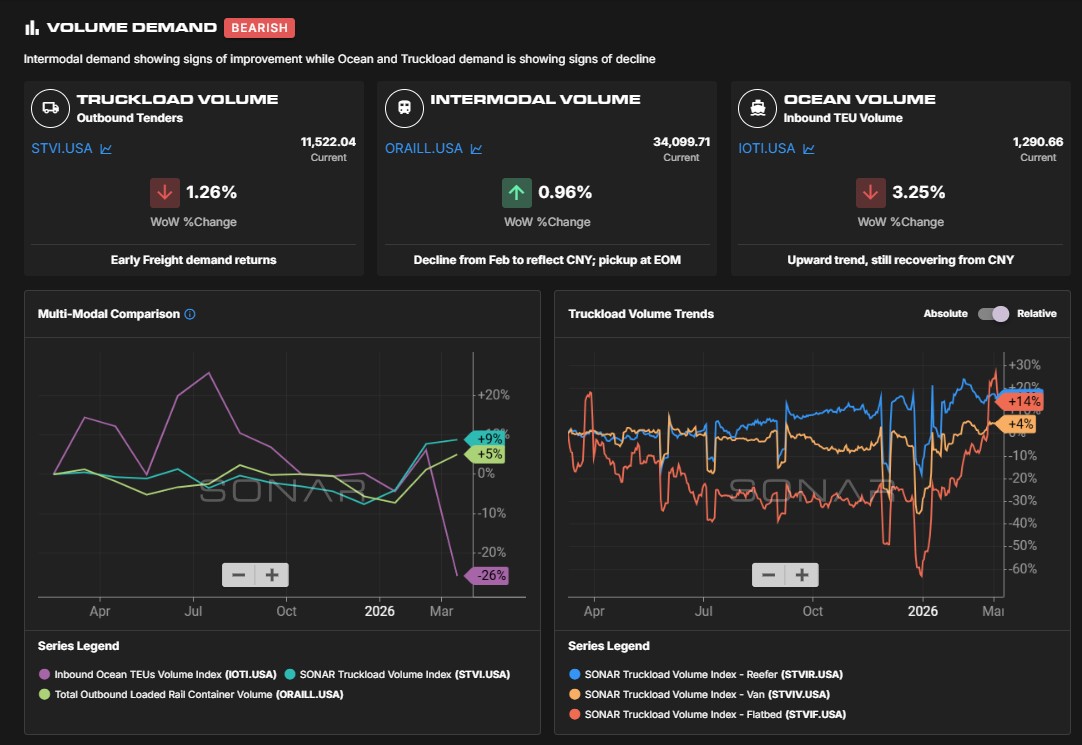
Volume Demand section on Executive Dashboard

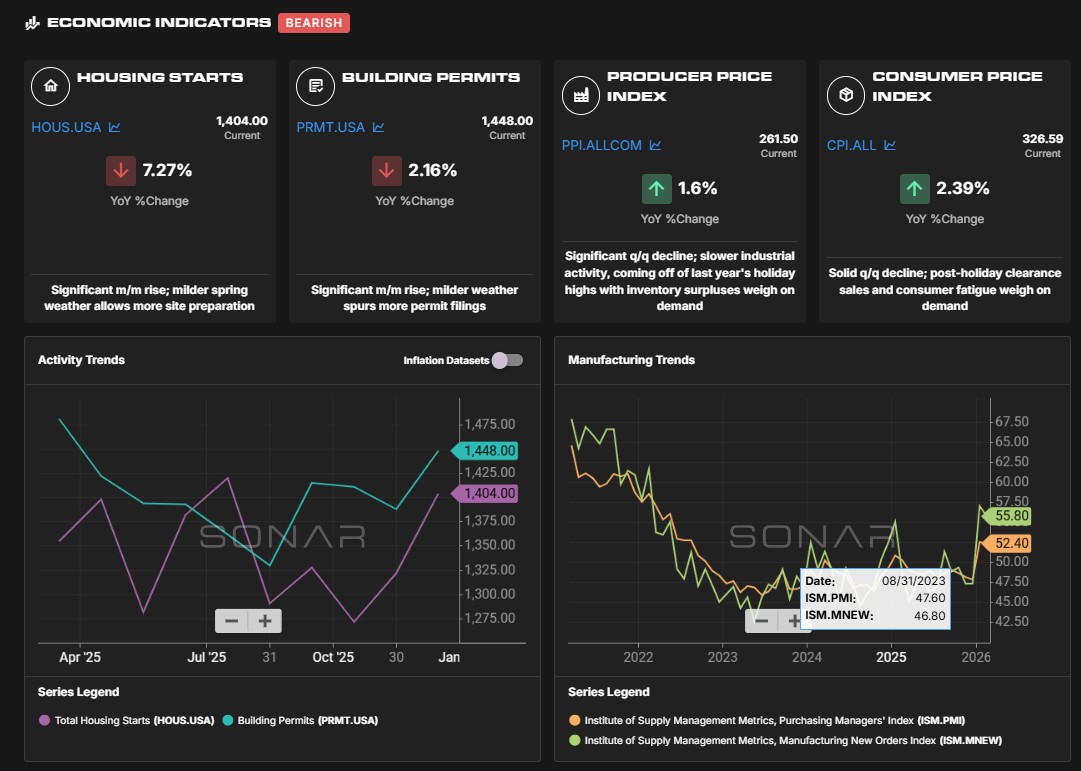
Economic Indicators on Executive Dashboard

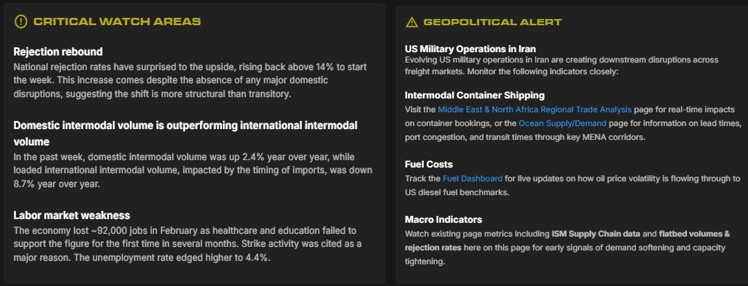
Critical Watch Areas and Geopolitical Alerts: Expert insights highlighting emerging risks, disruptions, and opportunities across the freight market.
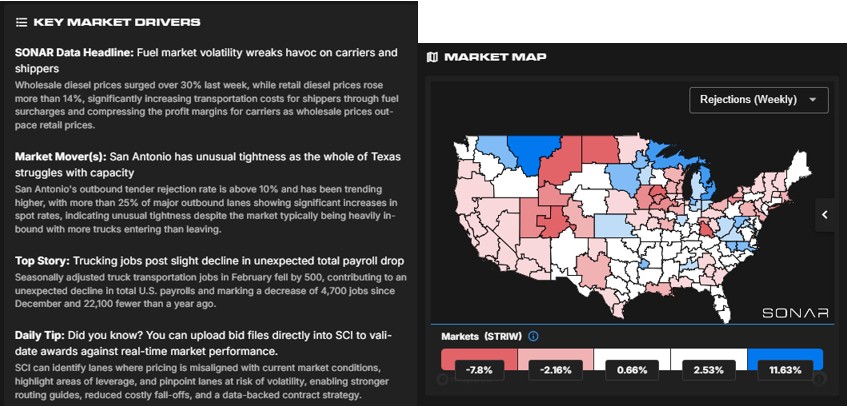
Key Market Drivers: The top factors influencing market conditions, pulled directly from our Daily Watch.

Dynamic Market Map: A national map showing weekly changes in volumes, tender rejections, and spot market conditions across markets.
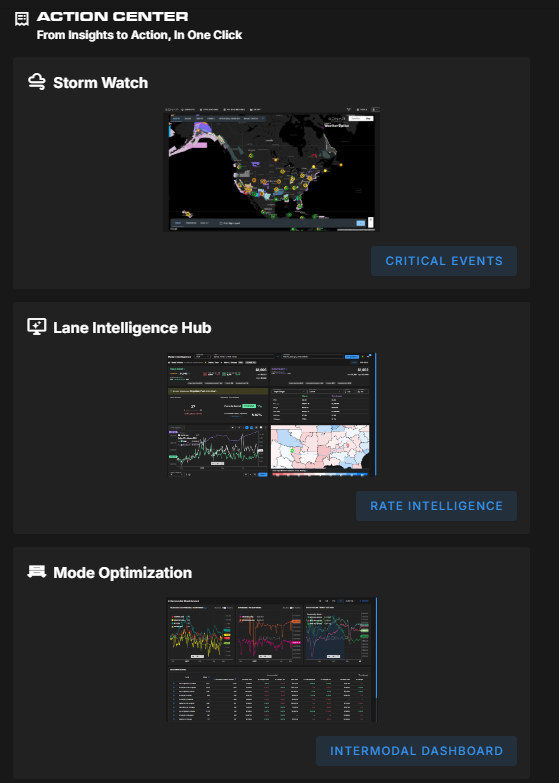
Action Center: A streamlined launchpad that connects you to SONAR tools and dashboards all from one central location.
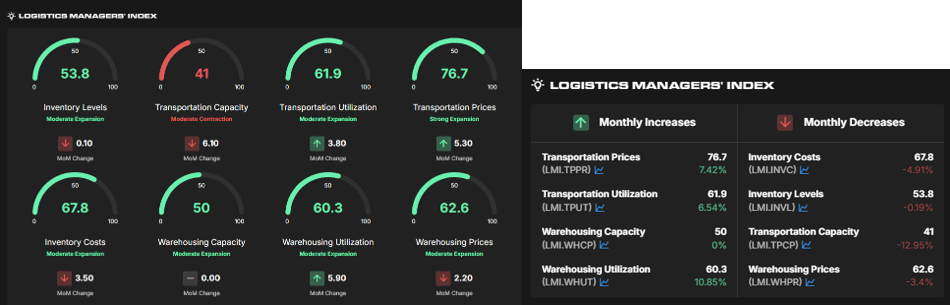
Logistics Mangers’ Index: Quickly assess supply chain health through gauge charts with MoM change that signal expansion or contraction across key logistics metrics

WHO IS INTERESTED?

Whether you’re tracking trends, preparing for customer conversations, or making fast operational decisions, the Executive Dashboard provides the intelligence you need to act with confidence.

Search Knowledge Center

Other Supply Chain Intelligence (SCI) Features

KC-Icon-App-SCI-Summary

Network Optimization

KC-Icon-App-SCI-Opportunity

Benchmarking

KC-Icon-App-SCI-Network

Network Health

Choose Another App

carrier sales

Coverage Guide

KC-Icon-App-Critical-Events

Critical Events

Customer Sales.jpg

Sales Guide

Dashboards Icon

Dashboards

lane-signal-icon

Excel Add-In

KC-Icon-App-Market-Dashboard

Rate Intelligence

lane-scorecard-icon

Batch Rate Intelligence

container-atlas-icon

Most Volatile Markets

blue analytics icon

SCI: Custom Insights

imports-by-consignee-icon

SONAR Charts

KC-Icon-App-SCI-Summary

SONAR Maps

download-18

Supply Chain Intelligence (SCI)

predictive-rates-icon

Watchlists

Not Sure Where To Start?