Lane View

WHAT IS IT?


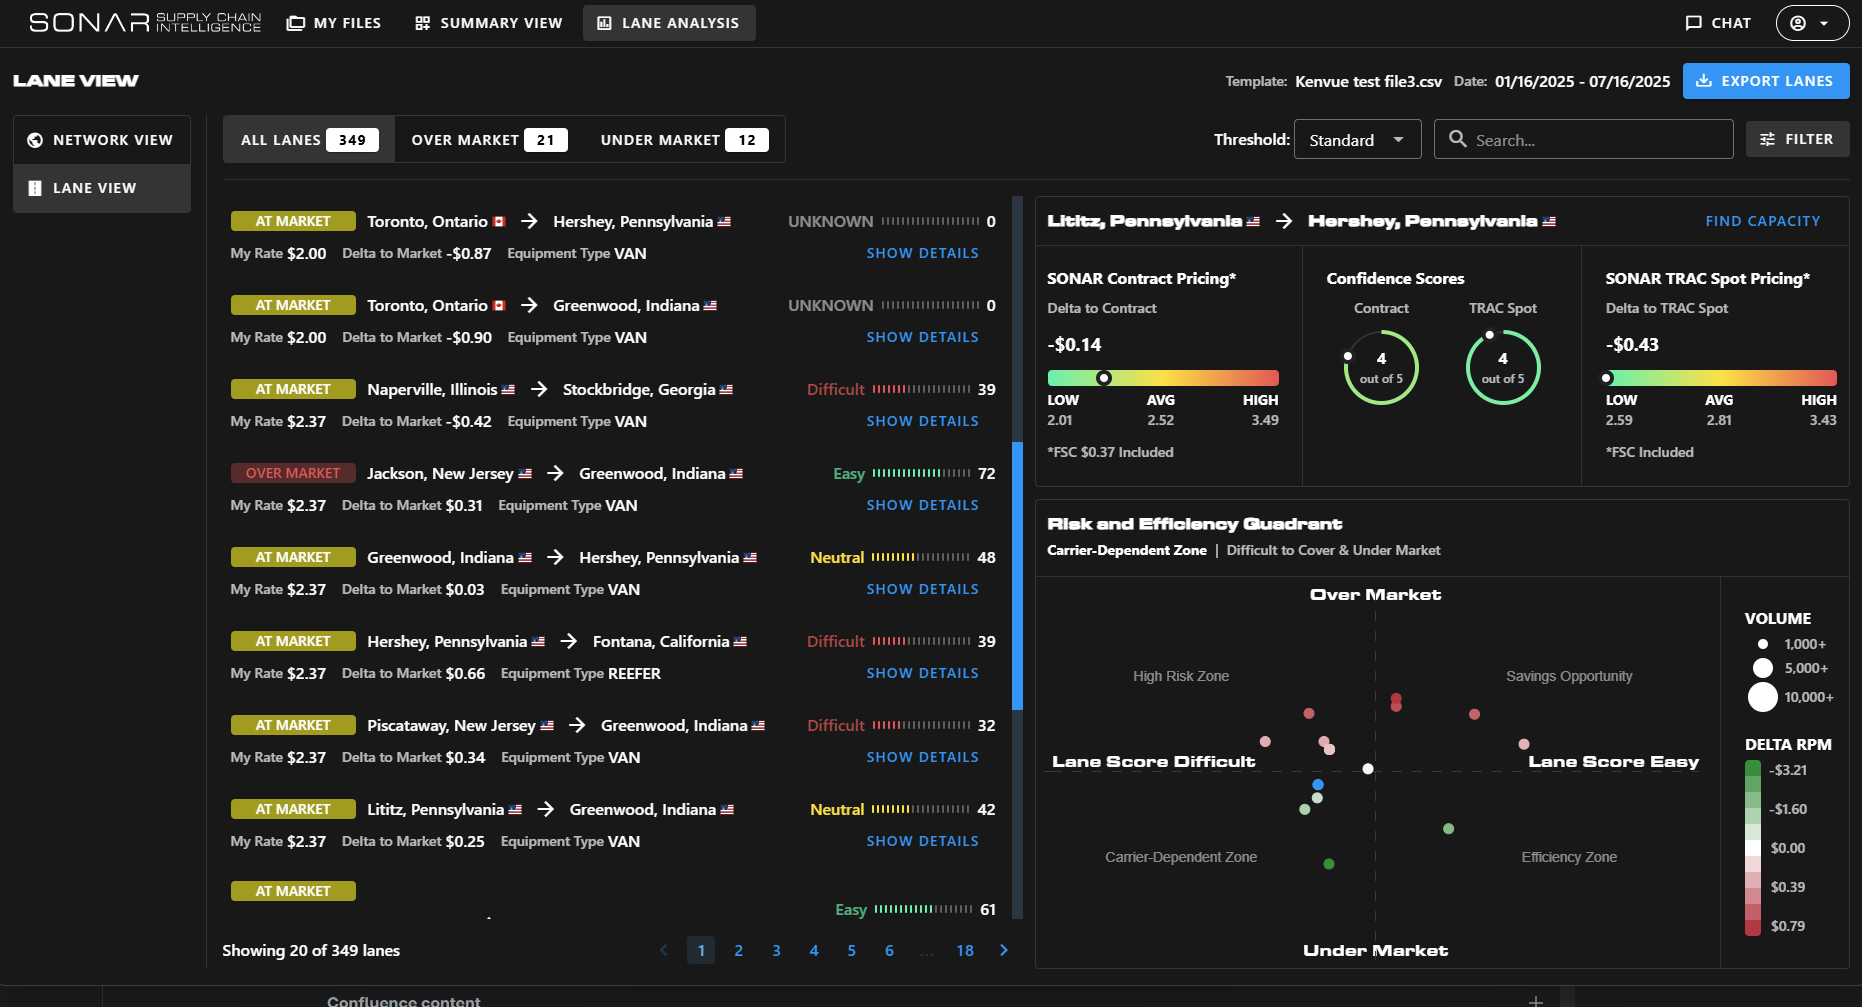
The Lane View is the most granular and powerful analysis view within SCI, providing a detailed breakdown of every lane in your uploaded data file alongside rich market intelligence. This page is purpose-built for strategic procurement teams who want to evaluate performance, identify opportunities, and act with precision lane by lane.

What You Can Do in the Lane View

  • Score and benchmark each lane to understand how your rates compare to the market.
  • Track trends and lane health with real-time rate movement and volatility indicators.
  • Compare side-by-side: Your contract rates vs. SONAR Contract Market Rates and TRAC Spot Rates all in one place.
  • Navigate confidently using SCI’s quadrant-based Risk and Efficiency Guide, visually plotting each lane to spotlight strategic opportunities.


Risk and Efficiency Quadrant: Each lane is automatically categorized into one of four quadrants to drive smarter negotiation and reallocation strategies:

  • High Risk Zone – Unstable lanes with poor performance or high volatility where you are over market.
  • Carrier Dependent Zone – Lanes with limited flexibility where you are under market.
  • Savings Opportunity – Lanes where your rates are significantly above market making them ideal for renegotiation.
  • Efficiency Zone – Reliable, cost-effective lanes performing well against benchmarks.


Key Data Points Available in Lane View

  • My Rate – Your uploaded linehaul rate per mile.
  • Contract Market Rate – Average contract rate for the lane from SONAR’s contract rate database (FSC included).
  • TRAC Spot Rate – Average spot rate from the TRAC consortium (FSC included).
  • Lane Score – A 1–100 score derived from tender data indicating capacity difficulty. Higher scores signal easier procurement conditions.
  • SONAR Contract & TRAC Spot Pricing Range – See the full range of rates reported in the market for both contract and spot, including your position and confidence scores.
  • Risk and Efficiency Quadrant– The quadrant-based Business Matrix that fuels strategic action
  • Additional Lane Attributes:
    • Delta to Contract
    • Equipment type
    • Length of haul
    • Total miles
    • Total spend
    • Total volume
    • Carbon emissions (in metric tons)


User Experience Highlights

  • Sort and filter lanes using the sidebar to prioritize your focus areas.
  • Click “Show Details” on any lane for expanded insights and lane level guidance.

Whether you’re refining your RFP strategy, identifying compliance risks, or prioritizing cost-saving actions, the Lane View empowers you with unmatched clarity and confidence at the lane level.


Search Knowledge Center

Other Supply Chain Intelligence (SCI) Features

KC-Icon-App-SCI-Network

Network View

KC-Icon-App-SCI-Summary

Summary View

Choose Another App

carrier sales

Coverage Guide

download-17

Container Atlas

KC-Icon-App-Critical-Events

Critical Events

Customer Sales.jpg

Sales Guide

lane-signal-icon

Excel Add-In

KC-Icon-App-Market-Dashboard

Rate Intelligence

lane-scorecard-icon

Batch Rate Intelligence

market icon

Key Market Insights

container-atlas-icon

Most Volatile Markets

KC-Icon-App-SCI-List

National Insights

imports-by-consignee-icon

SONAR Charts

KC-Icon-App-SCI-Summary

SONAR Maps

download-18

Supply Chain Intelligence (SCI)

predictive-rates-icon

Watchlists

Not Sure Where To Start?