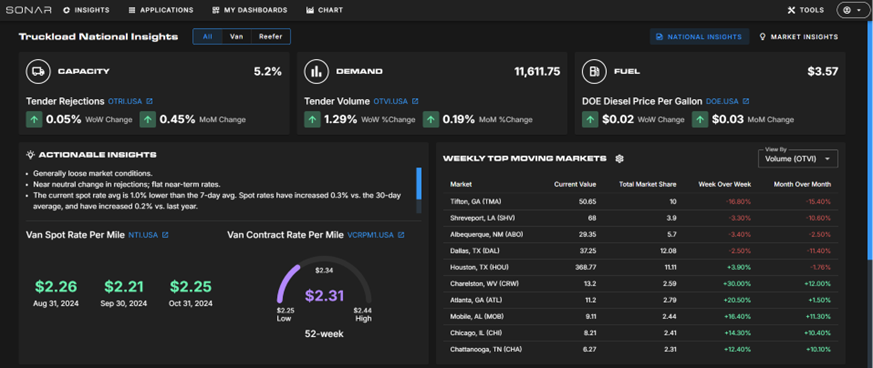
With millions of data points in SONAR, we understand that the sheer volume can feel overwhelming, sometimes leading to analysis paralysis. That’s why we’ve launched the new National Insights landing page, which zeroes in on the critical data Shippers, Brokers, and Carriers need to make informed decisions every day!

At the national level, you can see how capacity is shifting, changes in demand, and the direction of fuel prices.

Actionable Insights provides a plain-language summary to help you interpret the data shown on the page.

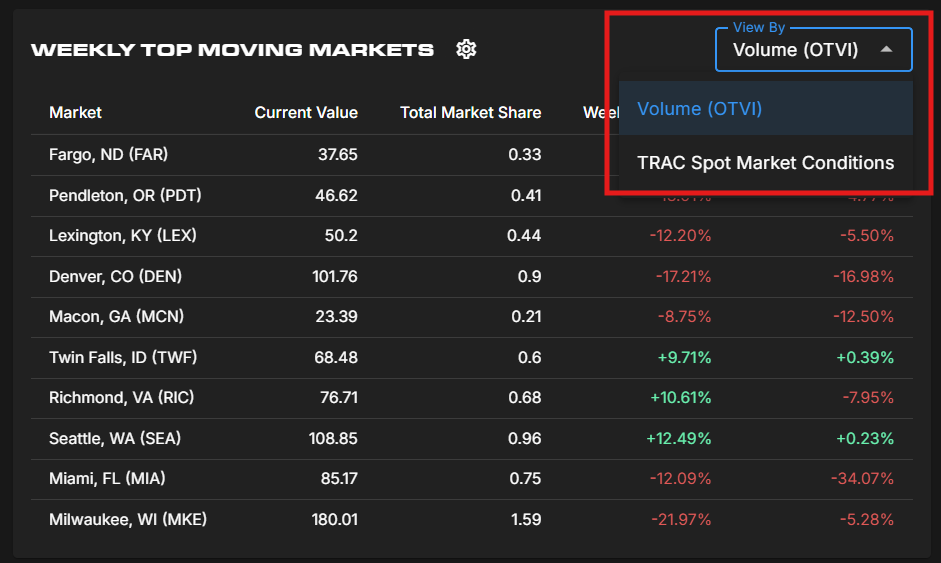
Weekly Top Moving Markets filters the markets with the largest changes (up and down) in Volume and Market Conditions (rate movement).

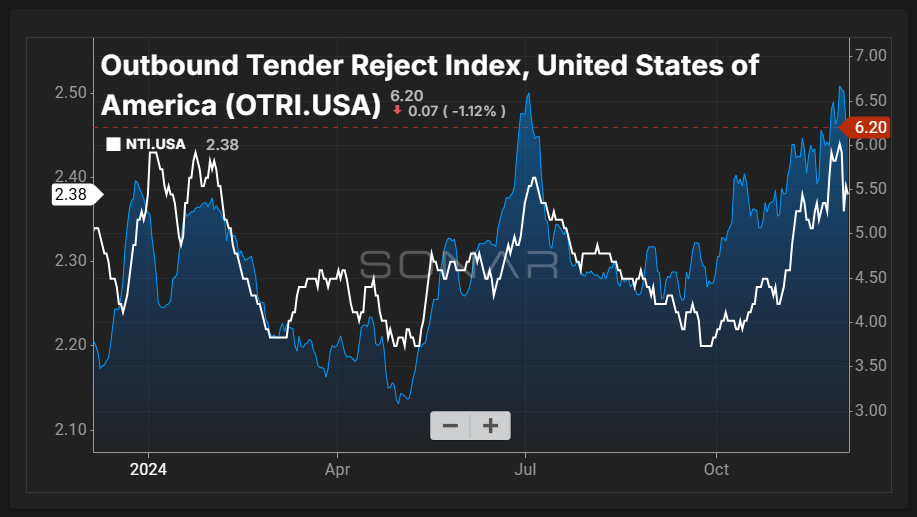
Stay proactive to shifting market conditions by monitoring the spread and direction of spot and contract rates.

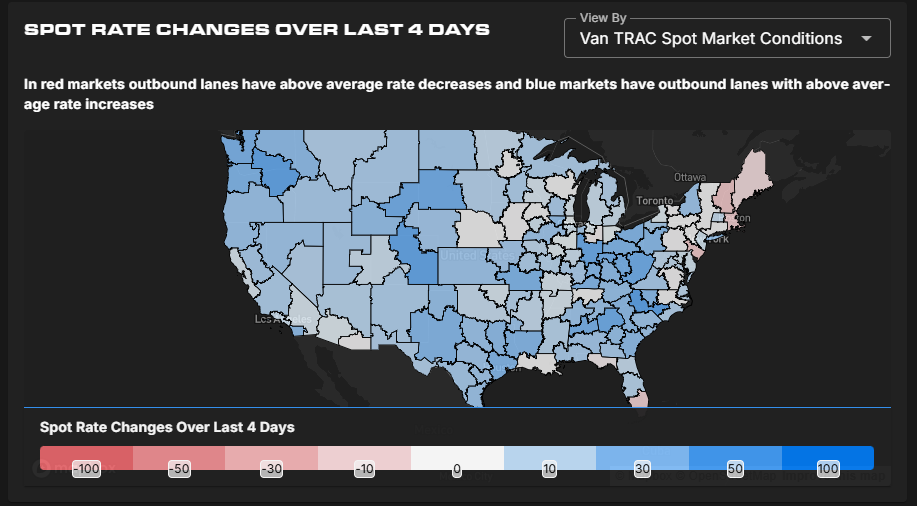
Finally, see how markets compare in tender rejections, volumes, and rate movement. Click on any market on the map to drill down to Market Insights!

Anyone who is involved in truck transportation. Brokers, Carrier Pricing, Carrier Sales, Load Planners, Transportation Managers