
SONAR Container Atlas provides an unprecedented level of visibility into the ocean container markets through various data points encompassing supply, demand, and HTS Code breakouts.

On the Supply and Demand page, users are able to view a set of analytics that help users understand volumes, capacity, lead times, and transit times. The data sets on this page are described in detail below:
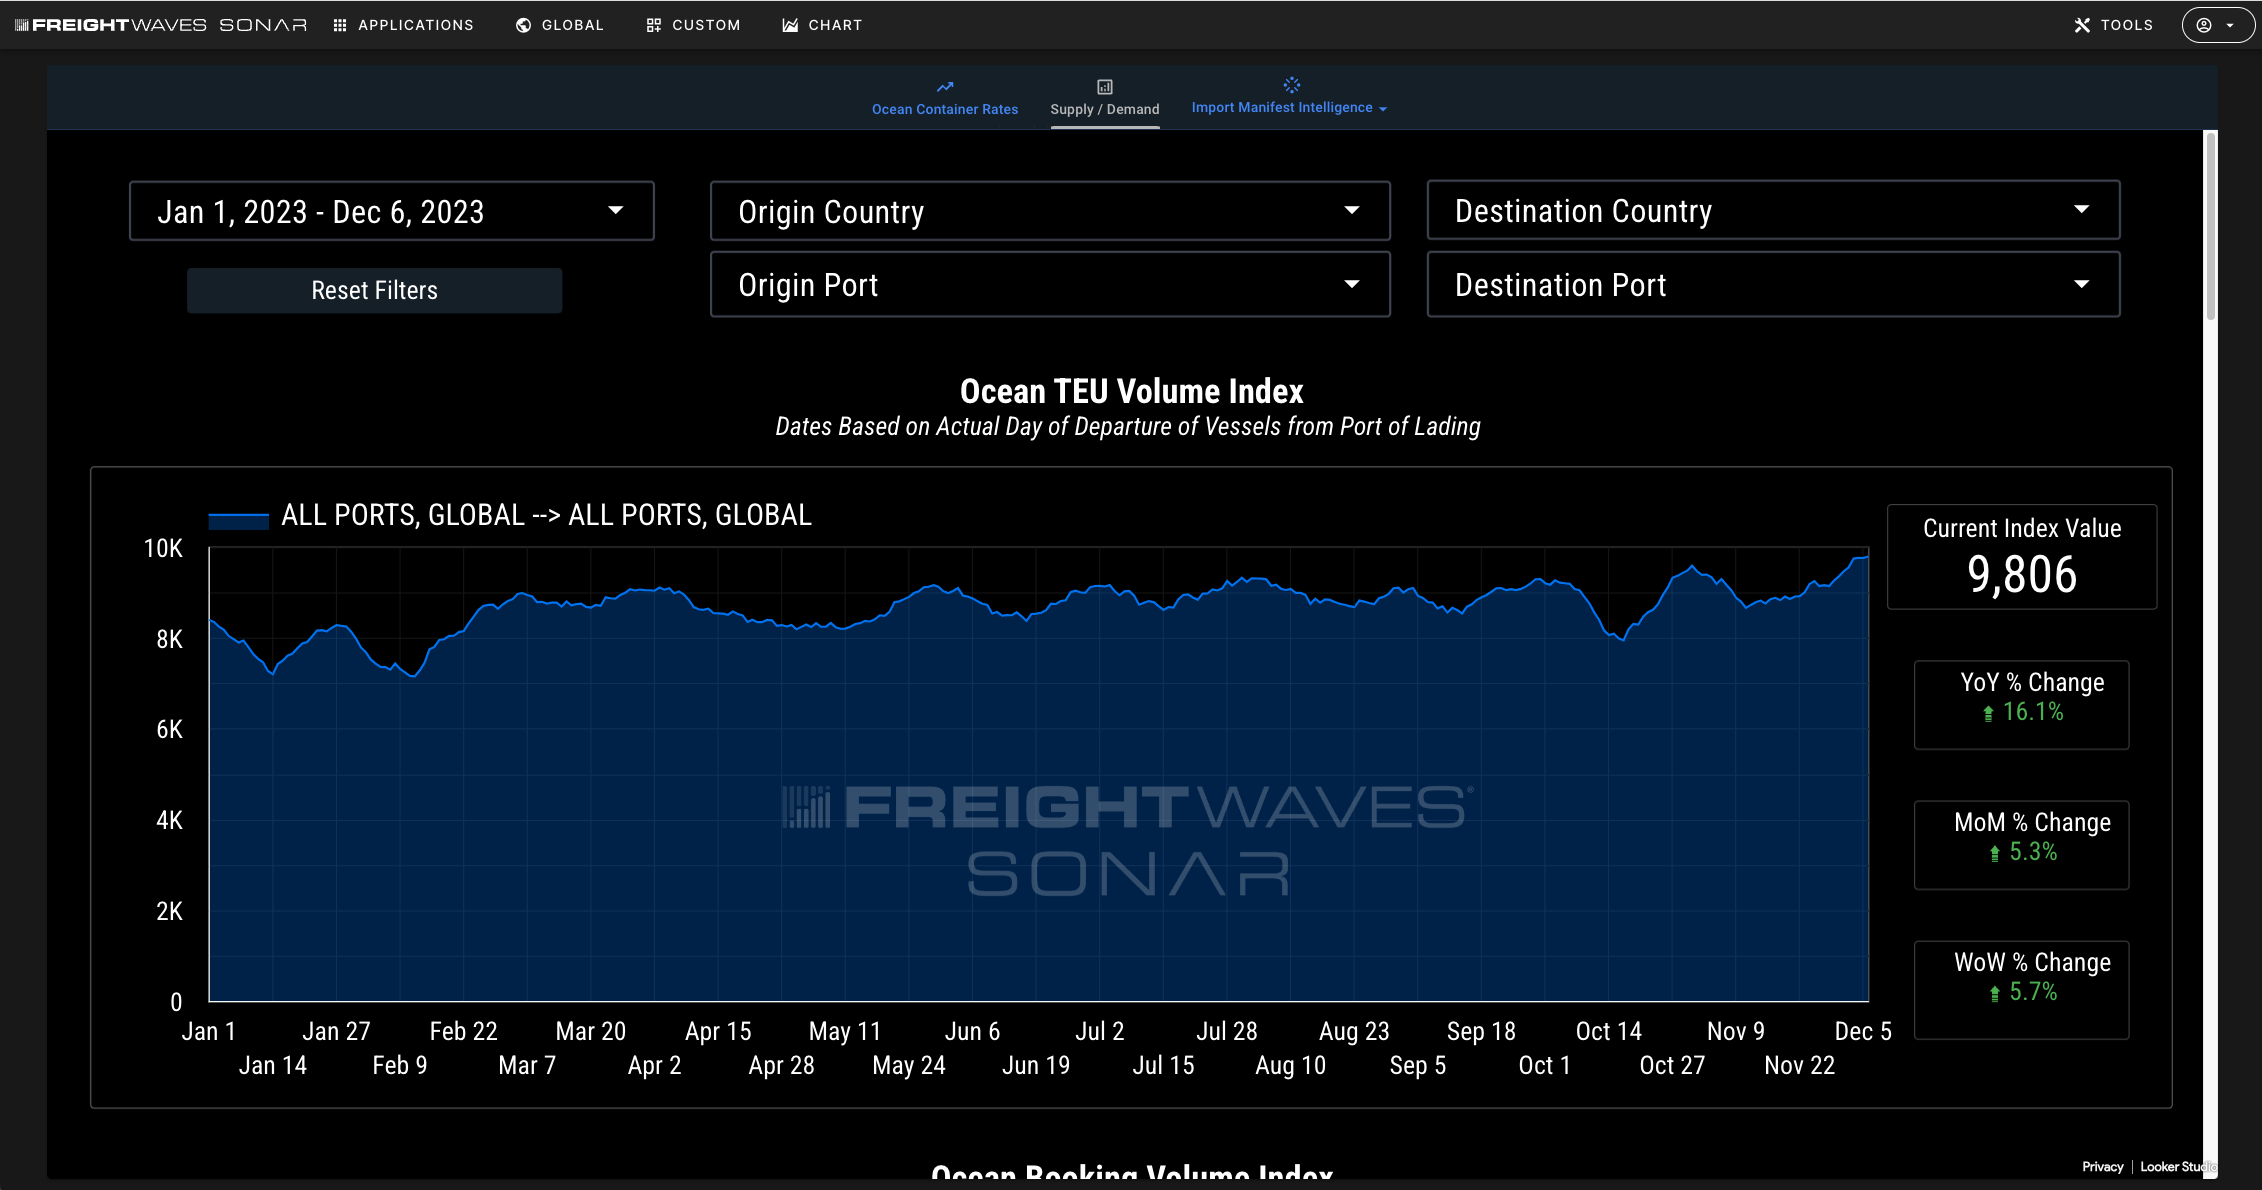
Ocean TEU Volume Index-
An index representing the daily volume of twenty-foot equivalent unit (TEU) volumes being booked with ocean container lines for a specific country of origin, or a specific port within a country of origin. The daily value is based on the Estimated Date of Departure (ETD) on each booking that has been confirmed by the ocean carrier as the date that the TEU volumes are intended to leave the specific origin. The index is also calculated on a 14-day moving average (of ETDs), and is indexed to August 1st, 2020 using a baseline of 10,000 for all global lane combinations. Each specific lane derivative’s index value is additive, meaning all lane index values aggregated would comprise the 10,000 baseline value.
Ocean TEU Booking Index –
This index represents the amount of twenty-foot equivalent unit (TEU) volumes being booked with ocean container lines for a specific trade lane. The date that is being used as the daily value is the date the booking was submitted to the ocean carriers to obtain space for the specified amount of TEUs. This index is calculated on a 7-day moving average of the submitted dates, and is indexed to August 1st, 2020.
Ocean TEU Rejection Index –
This index represents the percentage of twenty-foot equivalent unit (TEU) volumes being declined/rejected by ocean carriers on a specific trade lane. The primary reasons for the ocean carriers declining/rejecting volumes is due to lack of equipment or vessel space. This index is calculated on a 7-day moving average and based on the dates that the TEU volumes were declined by ocean carriers. This index only measures the volumes that have been declined in full, and not volumes that a carrier chooses to roll to the next vessel, or due to any cancellations, amendments, etc. from the shippers side.
Ocean TEU Vessel Capacity Index –
7 Day moving average of twenty-foot equivalent (TEU) vessel capacity calling a specific port of lading (POL). The date that is used for each index value is the actual date of departure from the POL. For any data that is forward-looking, the date is based on the estimated time of departure until that vessel actually departs, at which point, the date is substituted for the vessel’s actual time of departure. These future values are not a forecast but capacity expectations based on the estimated times of departure for each vessel based on bookings data.
Ocean TEU Transit Times –
This is a moving 7-day average of the transit times published on an ocean carrier’s booking confirmation. The transit times are calculated using the amount of days between the carrier’s estimated date of departure from the port of lading and the estimated date of arrival to the booking’s final port of discharge.
Project44 Ocean Port Pair Delays –
This is a weekly average of vessel days delayed between published transit times and actual transit times. These Project44 Ocean Container Port Pair Delays indicate sailing schedule compliance and service reliability at a lane-level on a monthly basis.
Ocean TEU Lead Times –
This is a moving 7-day average of the lead times for TEU volumes that have been confirmed by ocean carriers. The lead times are calculated using the amount of days between the initial date that the booking was confirmed and accepted by the ocean carrier, and the estimated date of departure for the vessel that the booking’s TEU volumes are attached to.
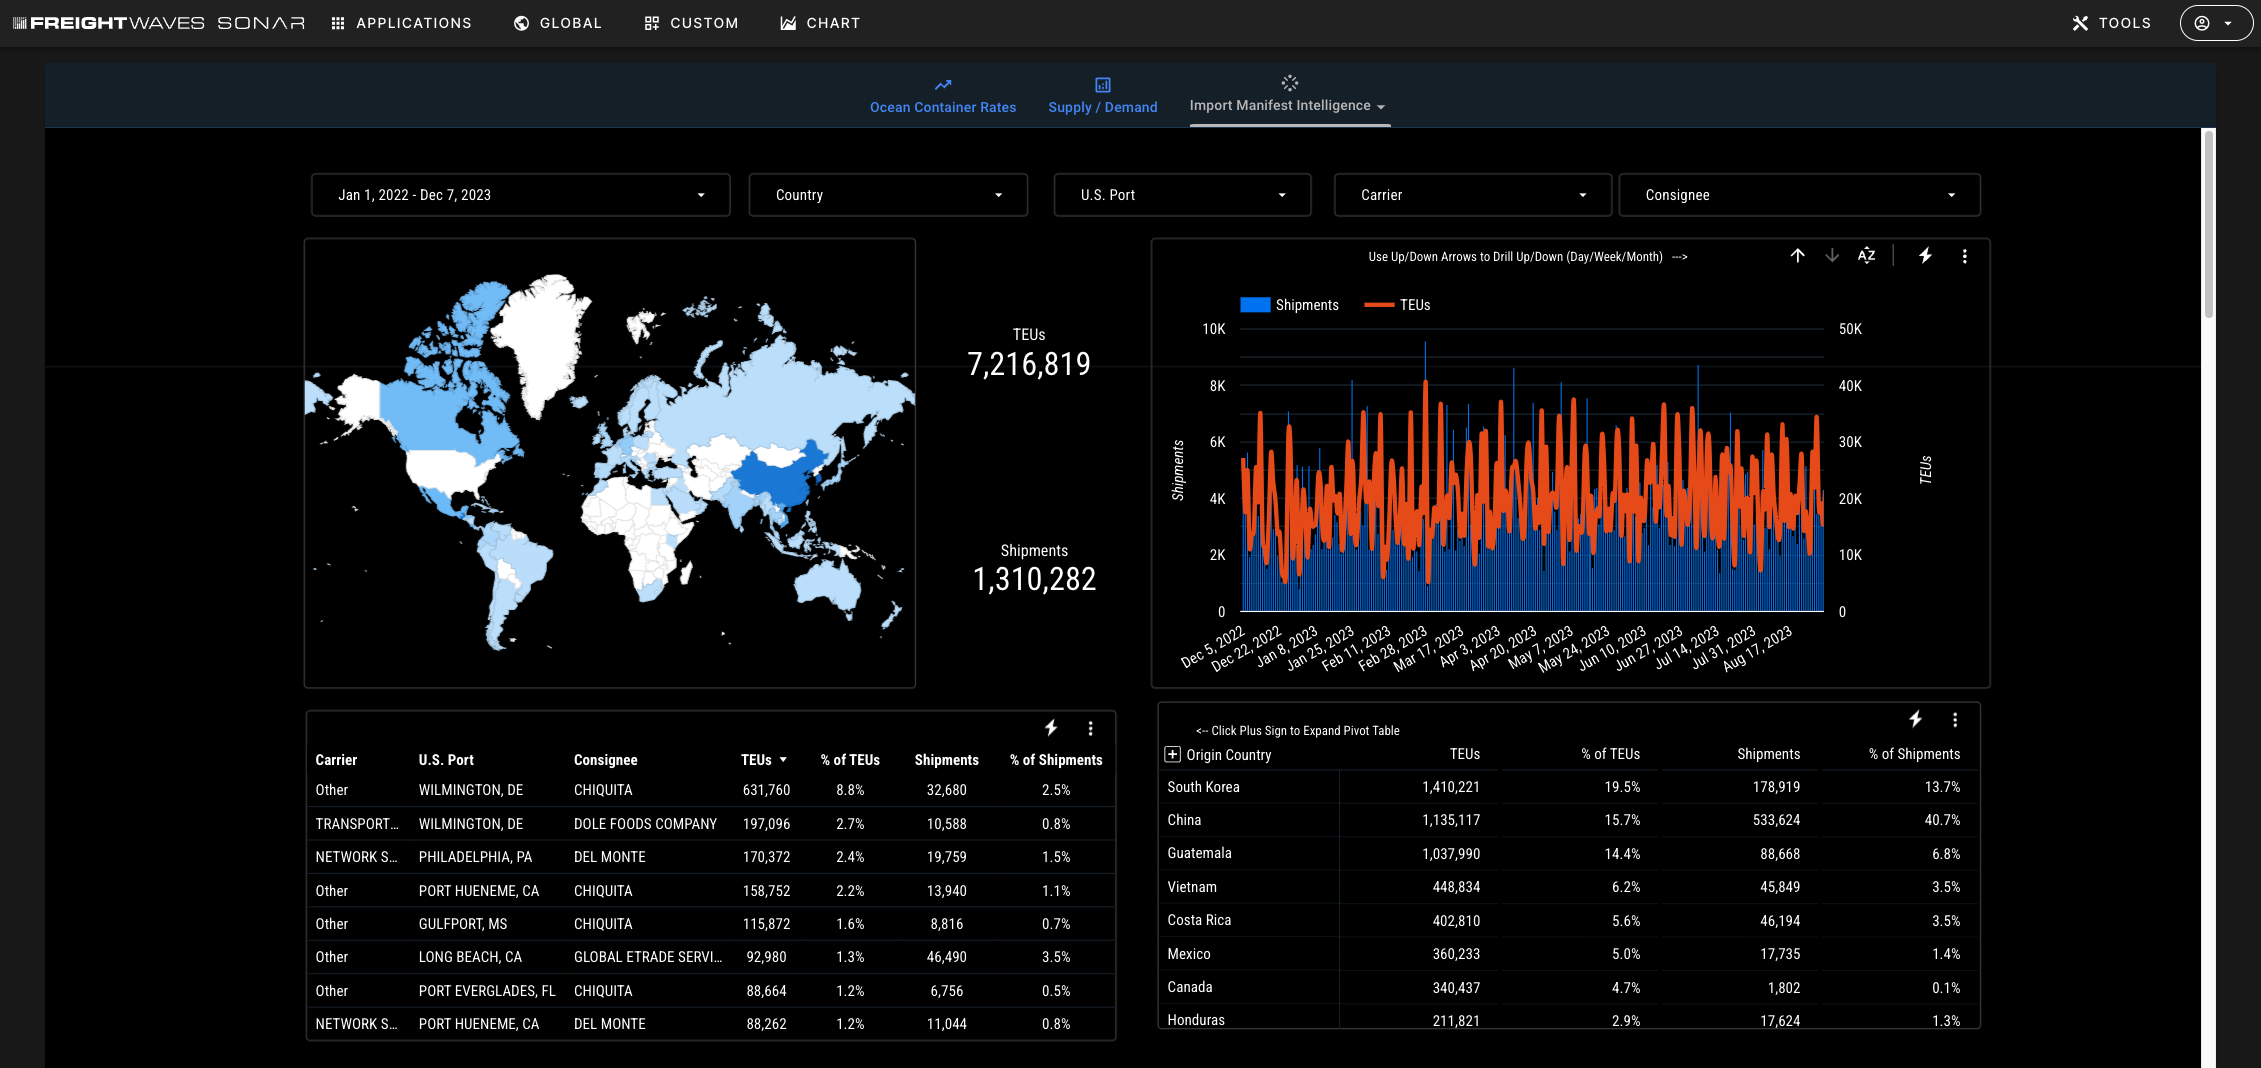
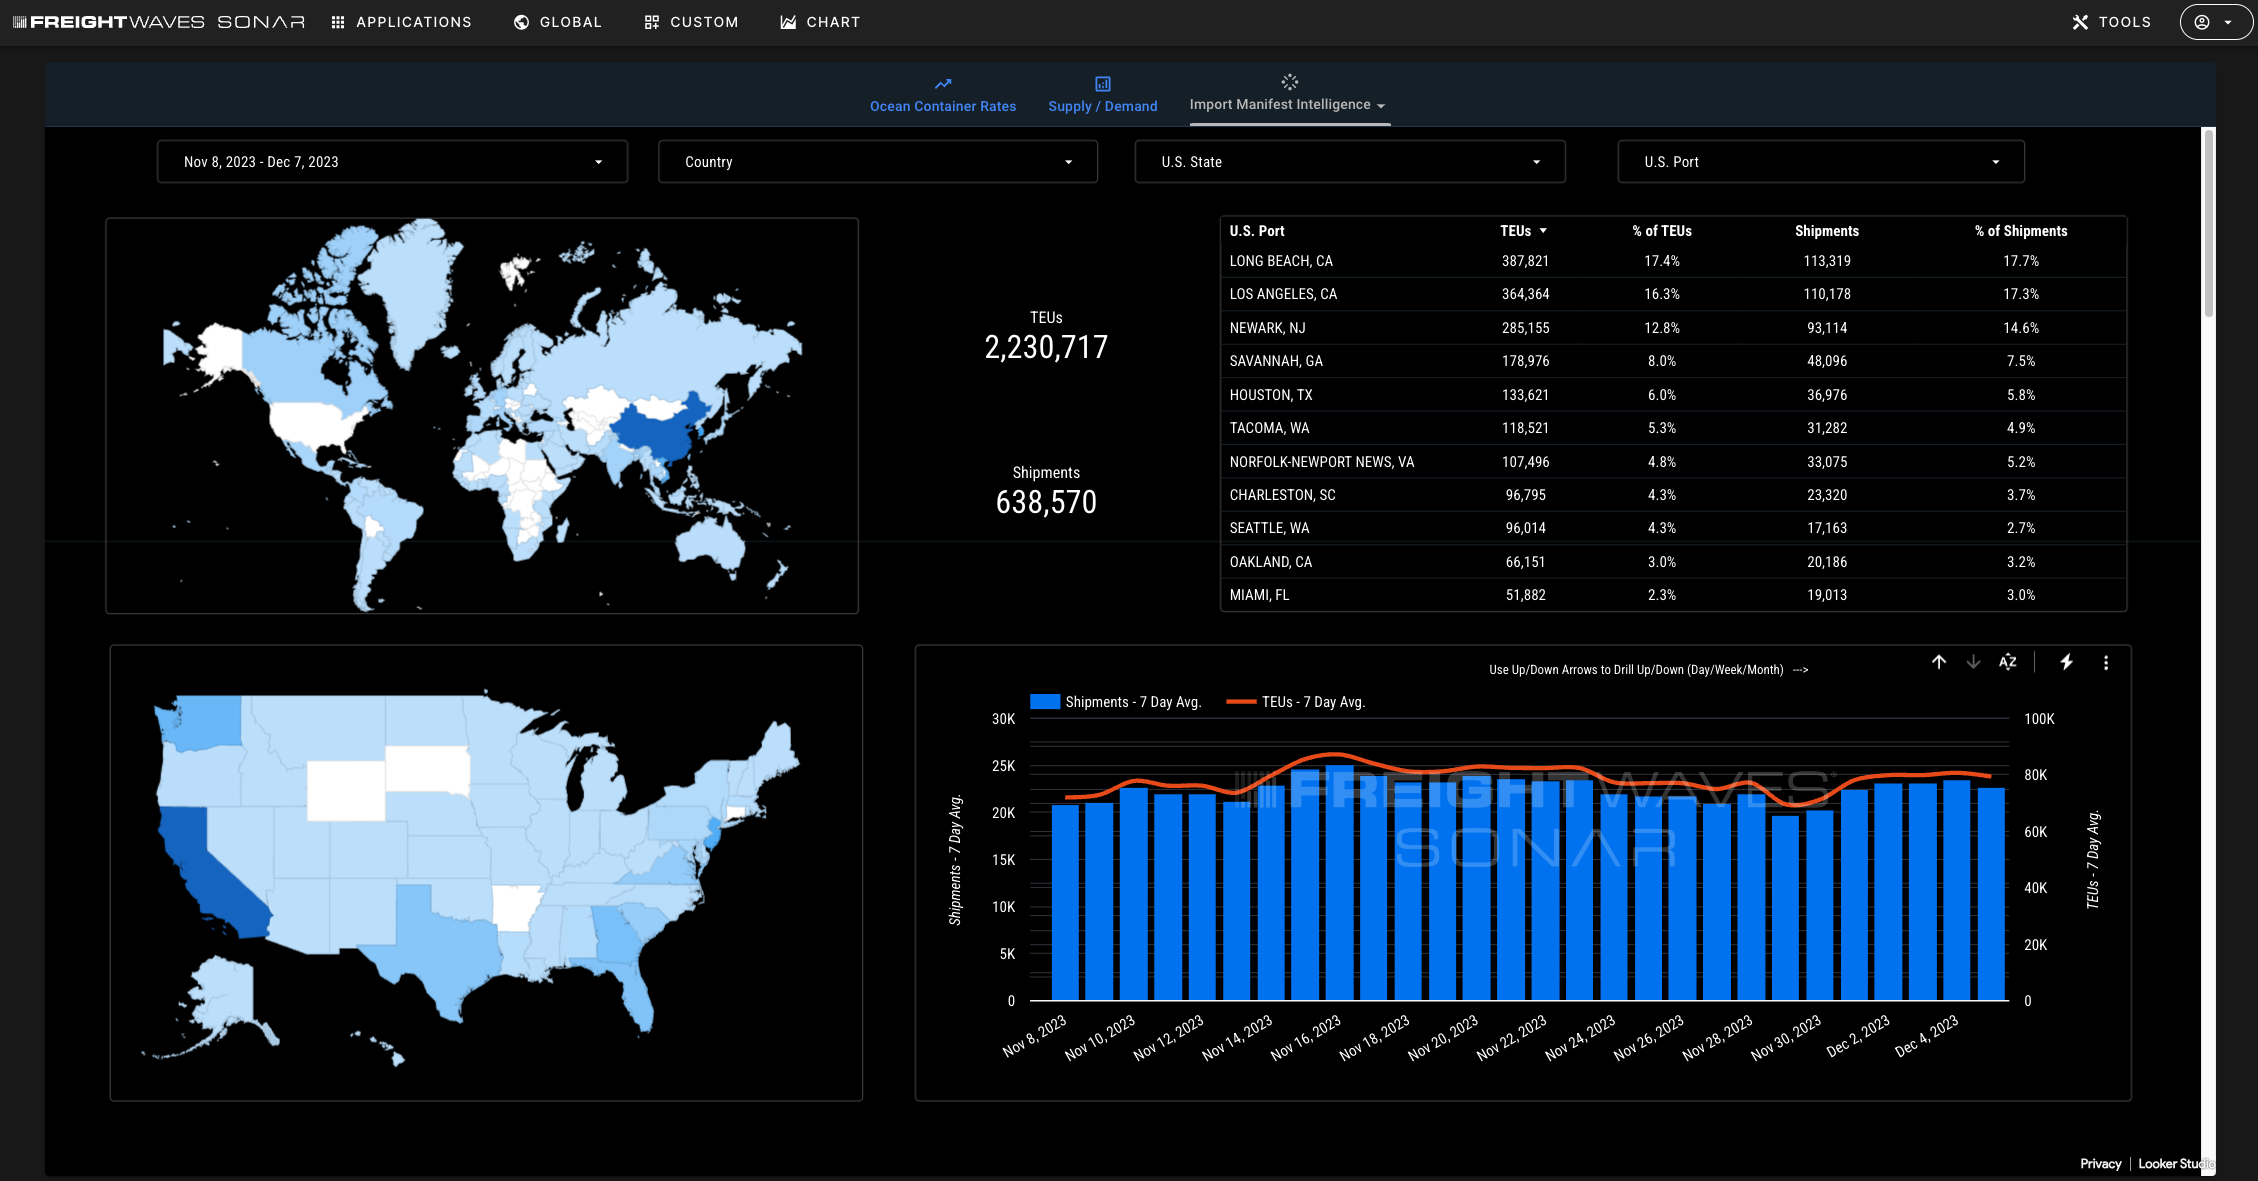
U.S. Customs Port Level Statistics –
This page is dedicated to showing shipment and twenty foot equivalent (TEU) volumes as they are being cleared and reported by U.S. Customs. When a shipment is being cleared for entry into the US, it is documented using the bill of lading which serves as documentation for the financial transaction between the buyer (US importer of record) and the shipper (seller) in a foreign country. This information is reported by US customs on average four to five days after the date that the shipment was actually cleared. Using this data, you are able to understand how US import volumes are trending before they are officially reported by each port authority in their monthly summary of volume statistics (usually comes out around the 15th of the following month.
Top 100 Consignees –
A prebuilt SONAR report that provides import bills of lading directly from U.S. Customs and Border Protection. The report shows the imports before they have been picked up by a dray carrier, domestic truckload provider, or an intermodal/rail provider. The data is updated daily.
Harmonized System (HS Codes)
Displays products being shipped globally broken out by the International Trade Association’s Harmonized System Codes. Chapter: Refers to the broad category of goods and is represented by the first 2 digits of the HS Code. Heading: Refers to a narrower category within the chapter and is represented by the first 4 digits of the HS Code
International Bookings
Bookings index, organized by the book date and is on a 7-day average and Rejections, a rolling 7-day average of the percent of bookings that were declined by ocean carriers, Lead and Transit times, number of days between booked date and schedule departure date and number of days between departure and arrival dates. Finally Top Gateways shows total volume booked broken out by origin country and HS Code
Trend Tables
First table is by origin country with volume percent along with week over week, month over month and year over year changes. The second chart drills down to the HTS codes with the same volume percent and changes shown.
Top USA Imports
This section shows the top shippers, consignees, carriers, trade routes and arrived customs volumes by month.